

Transverse Failure of Unidirectional Composites: Sensitivity to Interfacial Properties
337
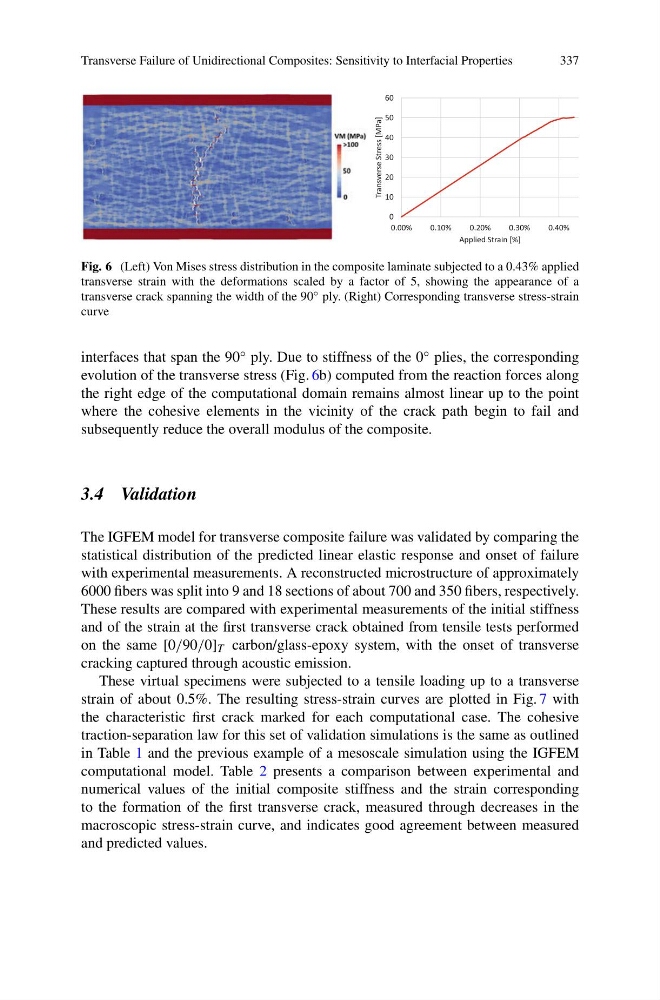
Fig. 6 (Left) Von Mises stress distribution in the composite laminate subjected to a 0.43% applied
transverse strain with the deformations scaled by a factor of 5, showing the appearance of a
transverse crack spanning the width of the 90 ◦ ply. (Right) Corresponding transverse stress-strain
curve
interfaces that span the 90 ◦ ply. Due to stiffness of the 0 ◦ plies, the corresponding
evolution of the transverse stress (Fig. 6b) computed from the reaction forces along
the right edge of the computational domain remains almost linear up to the point
where the cohesive elements in the vicinity of the crack path begin to fail and
subsequently reduce the overall modulus of the composite.
3.4 Validation
The IGFEM model for transverse composite failure was validated by comparing the
statistical distribution of the predicted linear elastic response and onset of failure
with experimental measurements. A reconstructed microstructure of approximately
6000 fibers was split into 9 and 18 sections of about 700 and 350 fibers, respectively.
These results are compared with experimental measurements of the initial stiffness
and of the strain at the first transverse crack obtained from tensile tests performed
on the same [0/90/0] T carbon/glass-epoxy system, with the onset of transverse
cracking captured through acoustic emission.
These virtual specimens were subjected to a tensile loading up to a transverse
strain of about 0.5%. The resulting stress-strain curves are plotted in Fig. 7 with
the characteristic first crack marked for each computational case. The cohesive
traction-separation law for this set of validation simulations is the same as outlined
in Table 1 and the previous example of a mesoscale simulation using the IGFEM
computational model. Table 2 presents a comparison between experimental and
numerical values of the initial composite stiffness and the strain corresponding
to the formation of the first transverse crack, measured through decreases in the
macroscopic stress-strain curve, and indicates good agreement between measured
and predicted values.
337
Fig. 6 (Left) Von Mises stress distribution in the composite laminate subjected to a 0.43% applied
transverse strain with the deformations scaled by a factor of 5, showing the appearance of a
transverse crack spanning the width of the 90 ◦ ply. (Right) Corresponding transverse stress-strain
curve
interfaces that span the 90 ◦ ply. Due to stiffness of the 0 ◦ plies, the corresponding
evolution of the transverse stress (Fig. 6b) computed from the reaction forces along
the right edge of the computational domain remains almost linear up to the point
where the cohesive elements in the vicinity of the crack path begin to fail and
subsequently reduce the overall modulus of the composite.
3.4 Validation
The IGFEM model for transverse composite failure was validated by comparing the
statistical distribution of the predicted linear elastic response and onset of failure
with experimental measurements. A reconstructed microstructure of approximately
6000 fibers was split into 9 and 18 sections of about 700 and 350 fibers, respectively.
These results are compared with experimental measurements of the initial stiffness
and of the strain at the first transverse crack obtained from tensile tests performed
on the same [0/90/0] T carbon/glass-epoxy system, with the onset of transverse
cracking captured through acoustic emission.
These virtual specimens were subjected to a tensile loading up to a transverse
strain of about 0.5%. The resulting stress-strain curves are plotted in Fig. 7 with
the characteristic first crack marked for each computational case. The cohesive
traction-separation law for this set of validation simulations is the same as outlined
in Table 1 and the previous example of a mesoscale simulation using the IGFEM
computational model. Table 2 presents a comparison between experimental and
numerical values of the initial composite stiffness and the strain corresponding
to the formation of the first transverse crack, measured through decreases in the
macroscopic stress-strain curve, and indicates good agreement between measured
and predicted values.