

332
S. Zacek et al.
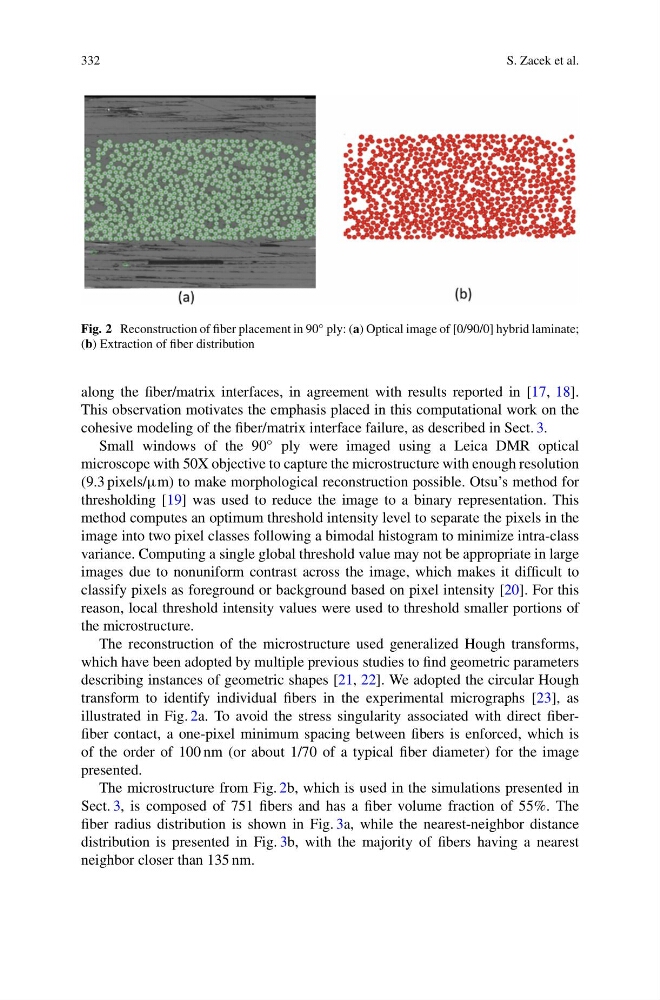
Fig. 2 Reconstruction of fiber placement in 90 ◦ ply: (a) Optical image of [0/90/0] hybrid laminate;
(b) Extraction of fiber distribution
along the fiber/matrix interfaces, in agreement with results reported in [17, 18].
This observation motivates the emphasis placed in this computational work on the
cohesive modeling of the fiber/matrix interface failure, as described in Sect. 3.
Small windows of the 90 ◦ ply were imaged using a Leica DMR optical
microscope with 50X objective to capture the microstructure with enough resolution
(9.3 pixels/μm) to make morphological reconstruction possible. Otsu’s method for
thresholding [19] was used to reduce the image to a binary representation. This
method computes an optimum threshold intensity level to separate the pixels in the
image into two pixel classes following a bimodal histogram to minimize intra-class
variance. Computing a single global threshold value may not be appropriate in large
images due to nonuniform contrast across the image, which makes it difficult to
classify pixels as foreground or background based on pixel intensity [20]. For this
reason, local threshold intensity values were used to threshold smaller portions of
the microstructure.
The reconstruction of the microstructure used generalized Hough transforms,
which have been adopted by multiple previous studies to find geometric parameters
describing instances of geometric shapes [21, 22]. We adopted the circular Hough
transform to identify individual fibers in the experimental micrographs [23], as
illustrated in Fig. 2a. To avoid the stress singularity associated with direct fiberfiber contact, a one-pixel minimum spacing between fibers is enforced, which is
of the order of 100 nm (or about 1/70 of a typical fiber diameter) for the image
presented.
The microstructure from Fig. 2b, which is used in the simulations presented in
Sect. 3, is composed of 751 fibers and has a fiber volume fraction of 55%. The
fiber radius distribution is shown in Fig. 3a, while the nearest-neighbor distance
distribution is presented in Fig. 3b, with the majority of fibers having a nearest
neighbor closer than 135 nm.
S. Zacek et al.
Fig. 2 Reconstruction of fiber placement in 90 ◦ ply: (a) Optical image of [0/90/0] hybrid laminate;
(b) Extraction of fiber distribution
along the fiber/matrix interfaces, in agreement with results reported in [17, 18].
This observation motivates the emphasis placed in this computational work on the
cohesive modeling of the fiber/matrix interface failure, as described in Sect. 3.
Small windows of the 90 ◦ ply were imaged using a Leica DMR optical
microscope with 50X objective to capture the microstructure with enough resolution
(9.3 pixels/μm) to make morphological reconstruction possible. Otsu’s method for
thresholding [19] was used to reduce the image to a binary representation. This
method computes an optimum threshold intensity level to separate the pixels in the
image into two pixel classes following a bimodal histogram to minimize intra-class
variance. Computing a single global threshold value may not be appropriate in large
images due to nonuniform contrast across the image, which makes it difficult to
classify pixels as foreground or background based on pixel intensity [20]. For this
reason, local threshold intensity values were used to threshold smaller portions of
the microstructure.
The reconstruction of the microstructure used generalized Hough transforms,
which have been adopted by multiple previous studies to find geometric parameters
describing instances of geometric shapes [21, 22]. We adopted the circular Hough
transform to identify individual fibers in the experimental micrographs [23], as
illustrated in Fig. 2a. To avoid the stress singularity associated with direct fiberfiber contact, a one-pixel minimum spacing between fibers is enforced, which is
of the order of 100 nm (or about 1/70 of a typical fiber diameter) for the image
presented.
The microstructure from Fig. 2b, which is used in the simulations presented in
Sect. 3, is composed of 751 fibers and has a fiber volume fraction of 55%. The
fiber radius distribution is shown in Fig. 3a, while the nearest-neighbor distance
distribution is presented in Fig. 3b, with the majority of fibers having a nearest
neighbor closer than 135 nm.