

SERVE-Boundary Conditions
309
component is not zero on the white SERVE boundary due to fiber interactions. It will
be shown in the following sections that the affine transformation-based displacement
boundary conditions (ATDBCs) or periodic boundary conditions (PBCs) applied on
the SERVE boundary suffer from poor accuracy.
3.1 Comparing ESBCs Generated by the 2-Point Correlation
and Radial Distribution Functions
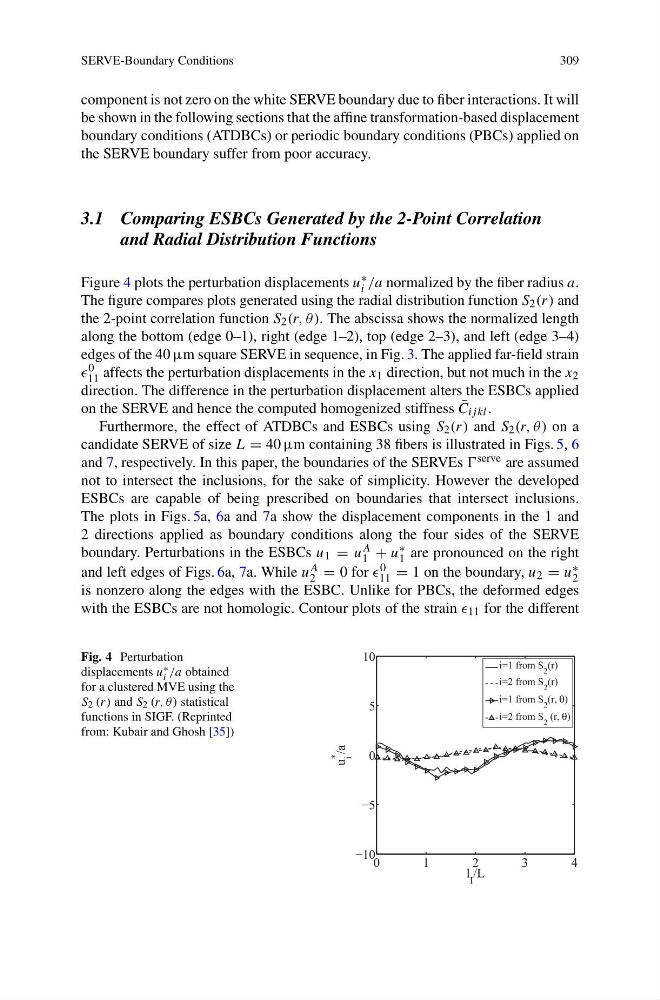
Figure 4 plots the perturbation displacements u ∗
i /a normalized by the fiber radius a.
The figure compares plots generated using the radial distribution function S 2 (r) and
the 2-point correlation function S 2 (r, θ ). The abscissa shows the normalized length
along the bottom (edge 0–1), right (edge 1–2), top (edge 2–3), and left (edge 3–4)
edges of the 40 μm square SERVE in sequence, in Fig. 3. The applied far-field strain
0
11 affects the perturbation displacements in the x 1 direction, but not much in the x 2
direction. The difference in the perturbation displacement alters the ESBCs applied
on the SERVE and hence the computed homogenized stiffness ¯
C ij kl .
Furthermore, the effect of ATDBCs and ESBCs using S 2 (r) and S 2 (r, θ ) on a
candidate SERVE of size L = 40 μm containing 38 fibers is illustrated in Figs. 5, 6
and 7, respectively. In this paper, the boundaries of the SERVEs serve are assumed
not to intersect the inclusions, for the sake of simplicity. However the developed
ESBCs are capable of being prescribed on boundaries that intersect inclusions.
The plots in Figs. 5a, 6a and 7a show the displacement components in the 1 and
2 directions applied as boundary conditions along the four sides of the SERVE
boundary. Perturbations in the ESBCs u 1 = u A
1 + u ∗
1 are pronounced on the right
and left edges of Figs. 6a, 7a. While u A
2 = 0 for 0
11 = 1 on the boundary, u 2 = u ∗
2
is nonzero along the edges with the ESBC. Unlike for PBCs, the deformed edges
with the ESBCs are not homologic. Contour plots of the strain 11 for the different
Fig. 4 Perturbation
displacements u ∗
i /a obtained
for a clustered MVE using the
S 2 (r) and S 2 (r, θ ) statistical
functions in SIGF. (Reprinted
from: Kubair and Ghosh [35])
309
component is not zero on the white SERVE boundary due to fiber interactions. It will
be shown in the following sections that the affine transformation-based displacement
boundary conditions (ATDBCs) or periodic boundary conditions (PBCs) applied on
the SERVE boundary suffer from poor accuracy.
3.1 Comparing ESBCs Generated by the 2-Point Correlation
and Radial Distribution Functions
Figure 4 plots the perturbation displacements u ∗
i /a normalized by the fiber radius a.
The figure compares plots generated using the radial distribution function S 2 (r) and
the 2-point correlation function S 2 (r, θ ). The abscissa shows the normalized length
along the bottom (edge 0–1), right (edge 1–2), top (edge 2–3), and left (edge 3–4)
edges of the 40 μm square SERVE in sequence, in Fig. 3. The applied far-field strain
0
11 affects the perturbation displacements in the x 1 direction, but not much in the x 2
direction. The difference in the perturbation displacement alters the ESBCs applied
on the SERVE and hence the computed homogenized stiffness ¯
C ij kl .
Furthermore, the effect of ATDBCs and ESBCs using S 2 (r) and S 2 (r, θ ) on a
candidate SERVE of size L = 40 μm containing 38 fibers is illustrated in Figs. 5, 6
and 7, respectively. In this paper, the boundaries of the SERVEs serve are assumed
not to intersect the inclusions, for the sake of simplicity. However the developed
ESBCs are capable of being prescribed on boundaries that intersect inclusions.
The plots in Figs. 5a, 6a and 7a show the displacement components in the 1 and
2 directions applied as boundary conditions along the four sides of the SERVE
boundary. Perturbations in the ESBCs u 1 = u A
1 + u ∗
1 are pronounced on the right
and left edges of Figs. 6a, 7a. While u A
2 = 0 for 0
11 = 1 on the boundary, u 2 = u ∗
2
is nonzero along the edges with the ESBC. Unlike for PBCs, the deformed edges
with the ESBCs are not homologic. Contour plots of the strain 11 for the different
Fig. 4 Perturbation
displacements u ∗
i /a obtained
for a clustered MVE using the
S 2 (r) and S 2 (r, θ ) statistical
functions in SIGF. (Reprinted
from: Kubair and Ghosh [35])