

A Framework for Quantifying Effects of Characterization Error on the. . .
235
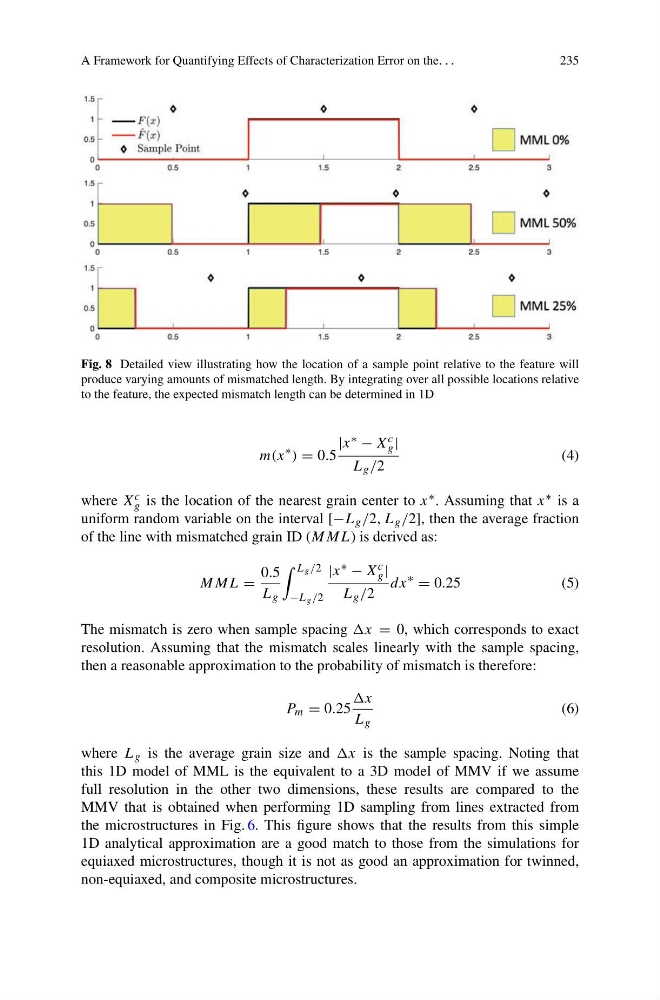
Fig. 8 Detailed view illustrating how the location of a sample point relative to the feature will
produce varying amounts of mismatched length. By integrating over all possible locations relative
to the feature, the expected mismatch length can be determined in 1D
m(x
∗ ) = 0.5
|x ∗ − X c
g |
L g /2
(4)
where X c
g is the location of the nearest grain center to x ∗ . Assuming that x ∗ is a
uniform random variable on the interval [−L g /2, L g /2], then the average fraction
of the line with mismatched grain ID (MML) is derived as:
MML =
0.5
L g
L g /2
−L g /2
|x ∗ − X c
g |
L g /2
dx
∗
= 0.25
(5)
The mismatch is zero when sample spacing x = 0, which corresponds to exact
resolution. Assuming that the mismatch scales linearly with the sample spacing,
then a reasonable approximation to the probability of mismatch is therefore:
P m = 0.25
x
L g
(6)
where L g is the average grain size and x is the sample spacing. Noting that
this 1D model of MML is the equivalent to a 3D model of MMV if we assume
full resolution in the other two dimensions, these results are compared to the
MMV that is obtained when performing 1D sampling from lines extracted from
the microstructures in Fig. 6. This figure shows that the results from this simple
1D analytical approximation are a good match to those from the simulations for
equiaxed microstructures, though it is not as good an approximation for twinned,
non-equiaxed, and composite microstructures.
235
Fig. 8 Detailed view illustrating how the location of a sample point relative to the feature will
produce varying amounts of mismatched length. By integrating over all possible locations relative
to the feature, the expected mismatch length can be determined in 1D
m(x
∗ ) = 0.5
|x ∗ − X c
g |
L g /2
(4)
where X c
g is the location of the nearest grain center to x ∗ . Assuming that x ∗ is a
uniform random variable on the interval [−L g /2, L g /2], then the average fraction
of the line with mismatched grain ID (MML) is derived as:
MML =
0.5
L g
L g /2
−L g /2
|x ∗ − X c
g |
L g /2
dx
∗
= 0.25
(5)
The mismatch is zero when sample spacing x = 0, which corresponds to exact
resolution. Assuming that the mismatch scales linearly with the sample spacing,
then a reasonable approximation to the probability of mismatch is therefore:
P m = 0.25
x
L g
(6)
where L g is the average grain size and x is the sample spacing. Noting that
this 1D model of MML is the equivalent to a 3D model of MMV if we assume
full resolution in the other two dimensions, these results are compared to the
MMV that is obtained when performing 1D sampling from lines extracted from
the microstructures in Fig. 6. This figure shows that the results from this simple
1D analytical approximation are a good match to those from the simulations for
equiaxed microstructures, though it is not as good an approximation for twinned,
non-equiaxed, and composite microstructures.