

234
N. Wade et al.
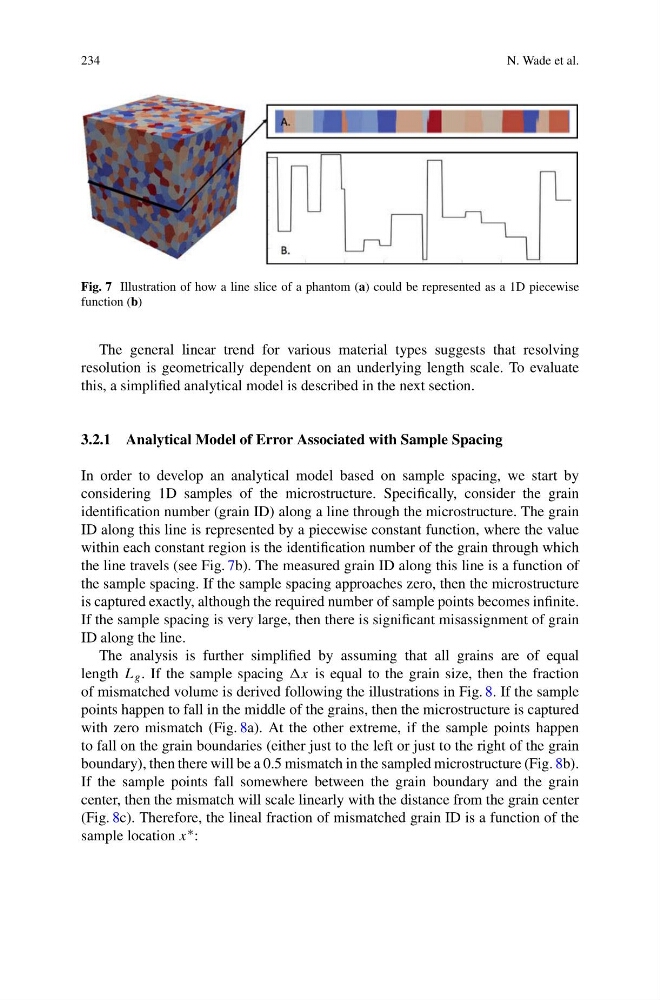
Fig. 7 Illustration of how a line slice of a phantom (a) could be represented as a 1D piecewise
function (b)
The general linear trend for various material types suggests that resolving
resolution is geometrically dependent on an underlying length scale. To evaluate
this, a simplified analytical model is described in the next section.
3.2.1 Analytical Model of Error Associated with Sample Spacing
In order to develop an analytical model based on sample spacing, we start by
considering 1D samples of the microstructure. Specifically, consider the grain
identification number (grain ID) along a line through the microstructure. The grain
ID along this line is represented by a piecewise constant function, where the value
within each constant region is the identification number of the grain through which
the line travels (see Fig. 7b). The measured grain ID along this line is a function of
the sample spacing. If the sample spacing approaches zero, then the microstructure
is captured exactly, although the required number of sample points becomes infinite.
If the sample spacing is very large, then there is significant misassignment of grain
ID along the line.
The analysis is further simplified by assuming that all grains are of equal
length L g . If the sample spacing x is equal to the grain size, then the fraction
of mismatched volume is derived following the illustrations in Fig. 8. If the sample
points happen to fall in the middle of the grains, then the microstructure is captured
with zero mismatch (Fig. 8a). At the other extreme, if the sample points happen
to fall on the grain boundaries (either just to the left or just to the right of the grain
boundary), then there will be a 0.5 mismatch in the sampled microstructure (Fig. 8b).
If the sample points fall somewhere between the grain boundary and the grain
center, then the mismatch will scale linearly with the distance from the grain center
(Fig. 8c). Therefore, the lineal fraction of mismatched grain ID is a function of the
sample location x ∗ :
N. Wade et al.
Fig. 7 Illustration of how a line slice of a phantom (a) could be represented as a 1D piecewise
function (b)
The general linear trend for various material types suggests that resolving
resolution is geometrically dependent on an underlying length scale. To evaluate
this, a simplified analytical model is described in the next section.
3.2.1 Analytical Model of Error Associated with Sample Spacing
In order to develop an analytical model based on sample spacing, we start by
considering 1D samples of the microstructure. Specifically, consider the grain
identification number (grain ID) along a line through the microstructure. The grain
ID along this line is represented by a piecewise constant function, where the value
within each constant region is the identification number of the grain through which
the line travels (see Fig. 7b). The measured grain ID along this line is a function of
the sample spacing. If the sample spacing approaches zero, then the microstructure
is captured exactly, although the required number of sample points becomes infinite.
If the sample spacing is very large, then there is significant misassignment of grain
ID along the line.
The analysis is further simplified by assuming that all grains are of equal
length L g . If the sample spacing x is equal to the grain size, then the fraction
of mismatched volume is derived following the illustrations in Fig. 8. If the sample
points happen to fall in the middle of the grains, then the microstructure is captured
with zero mismatch (Fig. 8a). At the other extreme, if the sample points happen
to fall on the grain boundaries (either just to the left or just to the right of the grain
boundary), then there will be a 0.5 mismatch in the sampled microstructure (Fig. 8b).
If the sample points fall somewhere between the grain boundary and the grain
center, then the mismatch will scale linearly with the distance from the grain center
(Fig. 8c). Therefore, the lineal fraction of mismatched grain ID is a function of the
sample location x ∗ :