

A Framework for Quantifying Effects of Characterization Error on the. . .
233
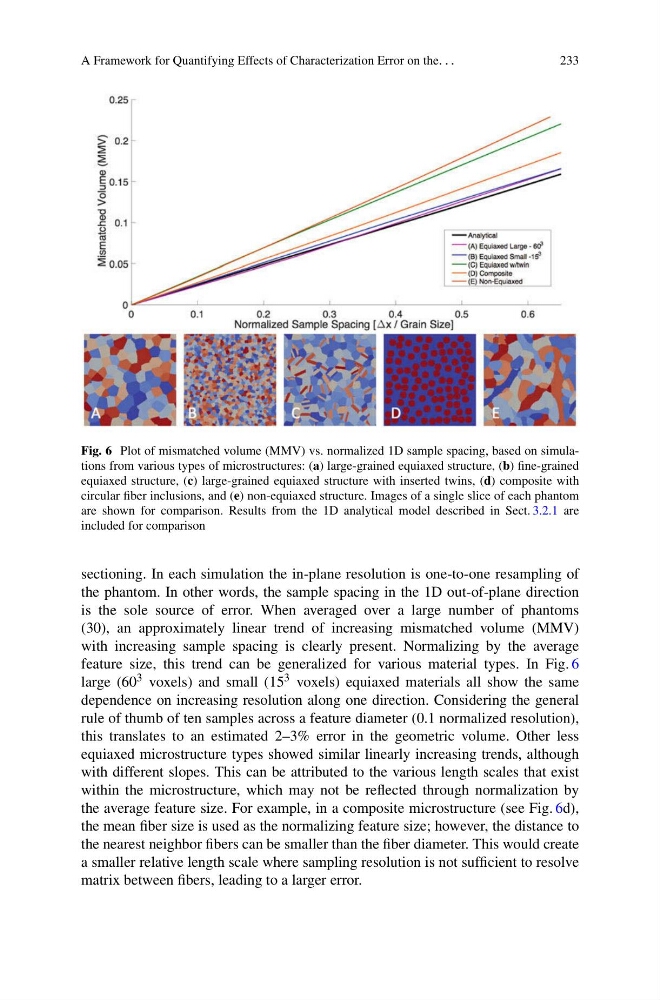
Fig. 6 Plot of mismatched volume (MMV) vs. normalized 1D sample spacing, based on simulations from various types of microstructures: (a) large-grained equiaxed structure, (b) fine-grained
equiaxed structure, (c) large-grained equiaxed structure with inserted twins, (d) composite with
circular fiber inclusions, and (e) non-equiaxed structure. Images of a single slice of each phantom
are shown for comparison. Results from the 1D analytical model described in Sect. 3.2.1 are
included for comparison
sectioning. In each simulation the in-plane resolution is one-to-one resampling of
the phantom. In other words, the sample spacing in the 1D out-of-plane direction
is the sole source of error. When averaged over a large number of phantoms
(30), an approximately linear trend of increasing mismatched volume (MMV)
with increasing sample spacing is clearly present. Normalizing by the average
feature size, this trend can be generalized for various material types. In Fig. 6
large (60 3 voxels) and small (15 3 voxels) equiaxed materials all show the same
dependence on increasing resolution along one direction. Considering the general
rule of thumb of ten samples across a feature diameter (0.1 normalized resolution),
this translates to an estimated 2–3% error in the geometric volume. Other less
equiaxed microstructure types showed similar linearly increasing trends, although
with different slopes. This can be attributed to the various length scales that exist
within the microstructure, which may not be reflected through normalization by
the average feature size. For example, in a composite microstructure (see Fig. 6d),
the mean fiber size is used as the normalizing feature size; however, the distance to
the nearest neighbor fibers can be smaller than the fiber diameter. This would create
a smaller relative length scale where sampling resolution is not sufficient to resolve
matrix between fibers, leading to a larger error.
233
Fig. 6 Plot of mismatched volume (MMV) vs. normalized 1D sample spacing, based on simulations from various types of microstructures: (a) large-grained equiaxed structure, (b) fine-grained
equiaxed structure, (c) large-grained equiaxed structure with inserted twins, (d) composite with
circular fiber inclusions, and (e) non-equiaxed structure. Images of a single slice of each phantom
are shown for comparison. Results from the 1D analytical model described in Sect. 3.2.1 are
included for comparison
sectioning. In each simulation the in-plane resolution is one-to-one resampling of
the phantom. In other words, the sample spacing in the 1D out-of-plane direction
is the sole source of error. When averaged over a large number of phantoms
(30), an approximately linear trend of increasing mismatched volume (MMV)
with increasing sample spacing is clearly present. Normalizing by the average
feature size, this trend can be generalized for various material types. In Fig. 6
large (60 3 voxels) and small (15 3 voxels) equiaxed materials all show the same
dependence on increasing resolution along one direction. Considering the general
rule of thumb of ten samples across a feature diameter (0.1 normalized resolution),
this translates to an estimated 2–3% error in the geometric volume. Other less
equiaxed microstructure types showed similar linearly increasing trends, although
with different slopes. This can be attributed to the various length scales that exist
within the microstructure, which may not be reflected through normalization by
the average feature size. For example, in a composite microstructure (see Fig. 6d),
the mean fiber size is used as the normalizing feature size; however, the distance to
the nearest neighbor fibers can be smaller than the fiber diameter. This would create
a smaller relative length scale where sampling resolution is not sufficient to resolve
matrix between fibers, leading to a larger error.