

208
C. A. Bronkhorst et al.
4.2 Numerical Simulation Results
Simulations of the tantalum on tantalum plate impact experiment described above
were performed with the explicit finite element code EPIC-06 [30]. The twodimensional simulations assumed axi-symmetry and preserved the anisotropy of
the geometry. Since cross-sectional metallography of the recovered samples was
an integral part of this study, simulation of the full experimental geometry, with
radial momentum trapping rings [19], was necessary. The exact geometry of the
experimental impact and sample plates was replicated numerically. Frictionless
contact surfaces between each of the independent members of the assembly were
assumed and have generally been found to be an accurate assumption for these
types of loading conditions. The details of the simulation used here can be found in
Bronkhorst et al. [10]. The simulation result with a computational cell size of 50 μm
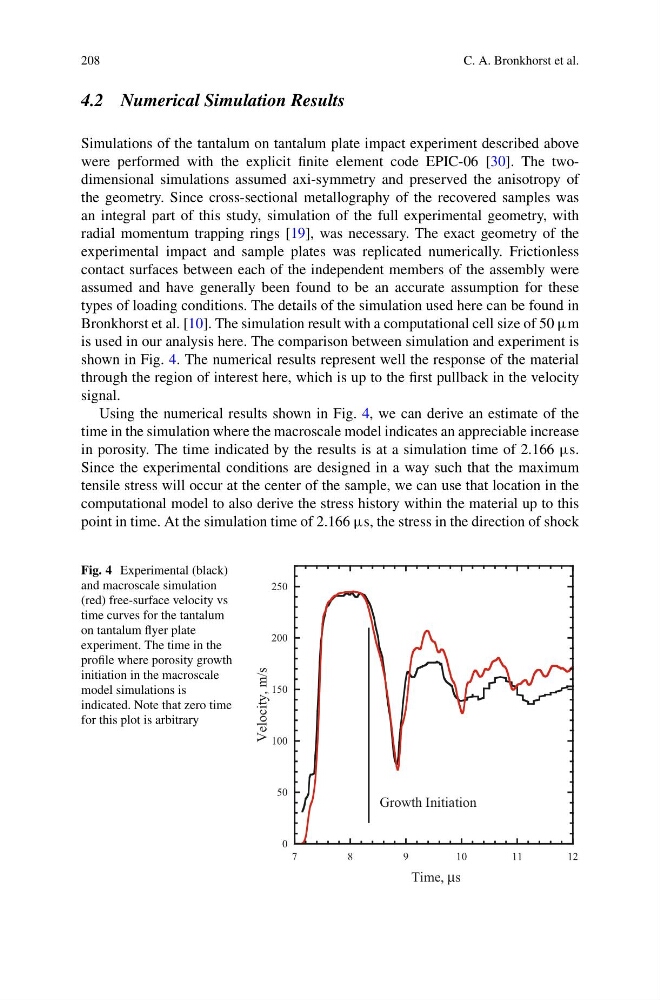
is used in our analysis here. The comparison between simulation and experiment is
shown in Fig. 4. The numerical results represent well the response of the material
through the region of interest here, which is up to the first pullback in the velocity
signal.
Using the numerical results shown in Fig. 4, we can derive an estimate of the
time in the simulation where the macroscale model indicates an appreciable increase
in porosity. The time indicated by the results is at a simulation time of 2.166 μs.
Since the experimental conditions are designed in a way such that the maximum
tensile stress will occur at the center of the sample, we can use that location in the
computational model to also derive the stress history within the material up to this
point in time. At the simulation time of 2.166 μs, the stress in the direction of shock
Fig. 4 Experimental (black)
and macroscale simulation
(red) free-surface velocity vs
time curves for the tantalum
on tantalum flyer plate
experiment. The time in the
profile where porosity growth
initiation in the macroscale
model simulations is
indicated. Note that zero time
for this plot is arbitrary
0
50
100
150
200
250
7
8
9
1 0
1 1
1 2
Velocity, m/s
Time, µs
Growth Initiation
C. A. Bronkhorst et al.
4.2 Numerical Simulation Results
Simulations of the tantalum on tantalum plate impact experiment described above
were performed with the explicit finite element code EPIC-06 [30]. The twodimensional simulations assumed axi-symmetry and preserved the anisotropy of
the geometry. Since cross-sectional metallography of the recovered samples was
an integral part of this study, simulation of the full experimental geometry, with
radial momentum trapping rings [19], was necessary. The exact geometry of the
experimental impact and sample plates was replicated numerically. Frictionless
contact surfaces between each of the independent members of the assembly were
assumed and have generally been found to be an accurate assumption for these
types of loading conditions. The details of the simulation used here can be found in
Bronkhorst et al. [10]. The simulation result with a computational cell size of 50 μm
is used in our analysis here. The comparison between simulation and experiment is
shown in Fig. 4. The numerical results represent well the response of the material
through the region of interest here, which is up to the first pullback in the velocity
signal.
Using the numerical results shown in Fig. 4, we can derive an estimate of the
time in the simulation where the macroscale model indicates an appreciable increase
in porosity. The time indicated by the results is at a simulation time of 2.166 μs.
Since the experimental conditions are designed in a way such that the maximum
tensile stress will occur at the center of the sample, we can use that location in the
computational model to also derive the stress history within the material up to this
point in time. At the simulation time of 2.166 μs, the stress in the direction of shock
Fig. 4 Experimental (black)
and macroscale simulation
(red) free-surface velocity vs
time curves for the tantalum
on tantalum flyer plate
experiment. The time in the
profile where porosity growth
initiation in the macroscale
model simulations is
indicated. Note that zero time
for this plot is arbitrary
0
50
100
150
200
250
7
8
9
1 0
1 1
1 2
Velocity, m/s
Time, µs
Growth Initiation