

Local Stress and Damage Response of Polycrystal Materials to Light Shock. . .
209
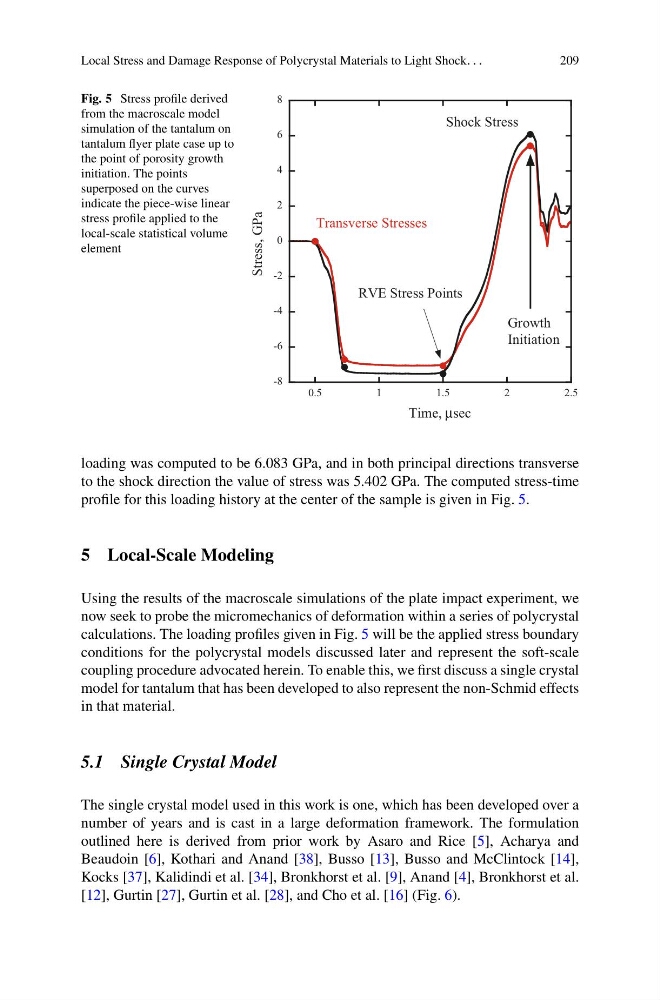
Fig. 5 Stress profile derived
from the macroscale model
simulation of the tantalum on
tantalum flyer plate case up to
the point of porosity growth
initiation. The points
superposed on the curves
indicate the piece-wise linear
stress profile applied to the
local-scale statistical volume
element
-8
-6
-4
-2
0
2
4
6
8
0.5
1
1.5
2
2.5
Stress, GPa
Time, µsec
Shock Stress
Transverse Stresses
RVE Stress Points
Growth
Initiation
loading was computed to be 6.083 GPa, and in both principal directions transverse
to the shock direction the value of stress was 5.402 GPa. The computed stress-time
profile for this loading history at the center of the sample is given in Fig. 5.
5 Local-Scale Modeling
Using the results of the macroscale simulations of the plate impact experiment, we
now seek to probe the micromechanics of deformation within a series of polycrystal
calculations. The loading profiles given in Fig. 5 will be the applied stress boundary
conditions for the polycrystal models discussed later and represent the soft-scale
coupling procedure advocated herein. To enable this, we first discuss a single crystal
model for tantalum that has been developed to also represent the non-Schmid effects
in that material.
5.1 Single Crystal Model
The single crystal model used in this work is one, which has been developed over a
number of years and is cast in a large deformation framework. The formulation
outlined here is derived from prior work by Asaro and Rice [5], Acharya and
Beaudoin [6], Kothari and Anand [38], Busso [13], Busso and McClintock [14],
Kocks [37], Kalidindi et al. [34], Bronkhorst et al. [9], Anand [4], Bronkhorst et al.
[12], Gurtin [27], Gurtin et al. [28], and Cho et al. [16] (Fig. 6).
209
Fig. 5 Stress profile derived
from the macroscale model
simulation of the tantalum on
tantalum flyer plate case up to
the point of porosity growth
initiation. The points
superposed on the curves
indicate the piece-wise linear
stress profile applied to the
local-scale statistical volume
element
-8
-6
-4
-2
0
2
4
6
8
0.5
1
1.5
2
2.5
Stress, GPa
Time, µsec
Shock Stress
Transverse Stresses
RVE Stress Points
Growth
Initiation
loading was computed to be 6.083 GPa, and in both principal directions transverse
to the shock direction the value of stress was 5.402 GPa. The computed stress-time
profile for this loading history at the center of the sample is given in Fig. 5.
5 Local-Scale Modeling
Using the results of the macroscale simulations of the plate impact experiment, we
now seek to probe the micromechanics of deformation within a series of polycrystal
calculations. The loading profiles given in Fig. 5 will be the applied stress boundary
conditions for the polycrystal models discussed later and represent the soft-scale
coupling procedure advocated herein. To enable this, we first discuss a single crystal
model for tantalum that has been developed to also represent the non-Schmid effects
in that material.
5.1 Single Crystal Model
The single crystal model used in this work is one, which has been developed over a
number of years and is cast in a large deformation framework. The formulation
outlined here is derived from prior work by Asaro and Rice [5], Acharya and
Beaudoin [6], Kothari and Anand [38], Busso [13], Busso and McClintock [14],
Kocks [37], Kalidindi et al. [34], Bronkhorst et al. [9], Anand [4], Bronkhorst et al.
[12], Gurtin [27], Gurtin et al. [28], and Cho et al. [16] (Fig. 6).