

Non-deterministic Calibration
187
Table 2 Fitting parameters
used in the CP model
Parameter (units) Value
m
0.05
g o (MPa)
130.0
˙
γ (
1
s )
1.0
G o (MPa)
100.41
g ∗
s (MPa)
113.91
ω
0.001
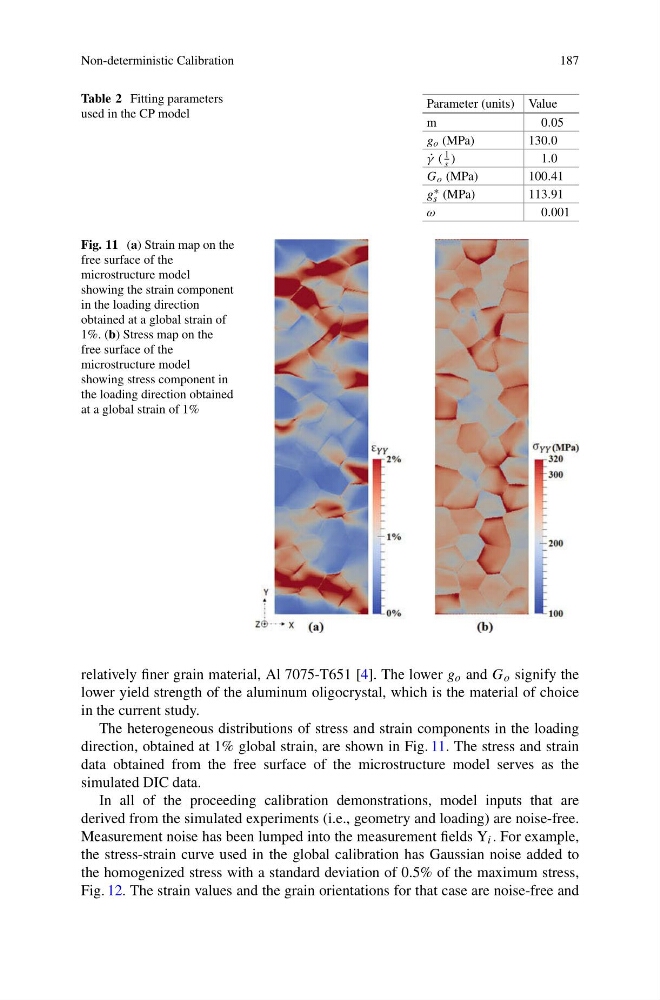
Fig. 11 (a) Strain map on the
free surface of the
microstructure model
showing the strain component
in the loading direction
obtained at a global strain of
1%. (b) Stress map on the
free surface of the
microstructure model
showing stress component in
the loading direction obtained
at a global strain of 1%
relatively finer grain material, Al 7075-T651 [4]. The lower g o and G o signify the
lower yield strength of the aluminum oligocrystal, which is the material of choice
in the current study.
The heterogeneous distributions of stress and strain components in the loading
direction, obtained at 1% global strain, are shown in Fig. 11. The stress and strain
data obtained from the free surface of the microstructure model serves as the
simulated DIC data.
In all of the proceeding calibration demonstrations, model inputs that are
derived from the simulated experiments (i.e., geometry and loading) are noise-free.
Measurement noise has been lumped into the measurement fields Y i . For example,
the stress-strain curve used in the global calibration has Gaussian noise added to
the homogenized stress with a standard deviation of 0.5% of the maximum stress,
Fig. 12. The strain values and the grain orientations for that case are noise-free and
187
Table 2 Fitting parameters
used in the CP model
Parameter (units) Value
m
0.05
g o (MPa)
130.0
˙
γ (
1
s )
1.0
G o (MPa)
100.41
g ∗
s (MPa)
113.91
ω
0.001
Fig. 11 (a) Strain map on the
free surface of the
microstructure model
showing the strain component
in the loading direction
obtained at a global strain of
1%. (b) Stress map on the
free surface of the
microstructure model
showing stress component in
the loading direction obtained
at a global strain of 1%
relatively finer grain material, Al 7075-T651 [4]. The lower g o and G o signify the
lower yield strength of the aluminum oligocrystal, which is the material of choice
in the current study.
The heterogeneous distributions of stress and strain components in the loading
direction, obtained at 1% global strain, are shown in Fig. 11. The stress and strain
data obtained from the free surface of the microstructure model serves as the
simulated DIC data.
In all of the proceeding calibration demonstrations, model inputs that are
derived from the simulated experiments (i.e., geometry and loading) are noise-free.
Measurement noise has been lumped into the measurement fields Y i . For example,
the stress-strain curve used in the global calibration has Gaussian noise added to
the homogenized stress with a standard deviation of 0.5% of the maximum stress,
Fig. 12. The strain values and the grain orientations for that case are noise-free and