

144
Chapter 10. Combining directed and signed embeddings
Name
pos-pos neg-neg
ROMUL
0.848
1.023
BONAVEN
0.247
0.000
AMBROSE
0.899
5.638
BERTH
1.609
1.994
PETER
2.026
10.851
LOUIS
0.747
3.710
VICTOR
1.037
3.372
WINF
0.978
0.696
JOHN
1.731
3.448
GREG
0.523
8.541
HUGH
0.367
3.399
BONI
0.691
5.964
MARK
0.877
2.957
ALBERT
0.544
5.195
AMAND
1.241
1.691
BASIL
0.654
5.921
ELIAS
0.854
3.315
SIMP
1.372
3.283
Means
0.958
3.944
STD
0.478
2.739
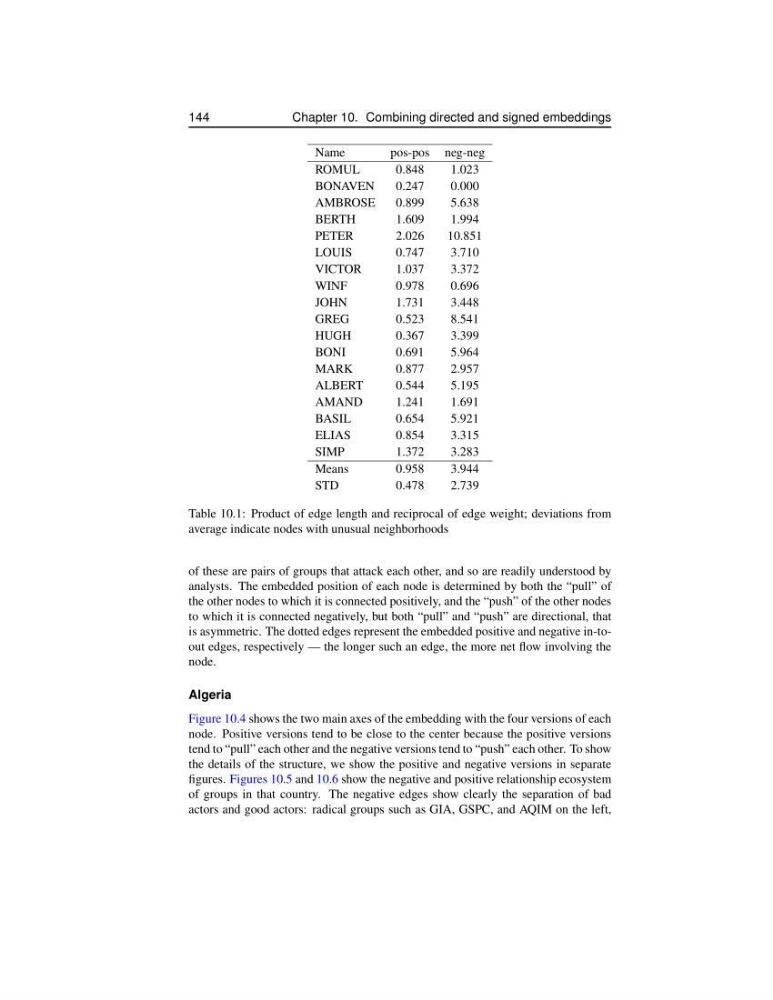
Table 10.1: Product of edge length and reciprocal of edge weight; deviations from
average indicate nodes with unusual neighborhoods
of these are pairs of groups that attack each other, and so are readily understood by
analysts. The embedded position of each node is determined by both the “pull” of
the other nodes to which it is connected positively, and the “push” of the other nodes
to which it is connected negatively, but both “pull” and “push” are directional, that
is asymmetric. The dotted edges represent the embedded positive and negative in-toout edges, respectively — the longer such an edge, the more net flow involving the
node.
Algeria
Figure 10.4 shows the two main axes of the embedding with the four versions of each
node. Positive versions tend to be close to the center because the positive versions
tend to “pull” each other and the negative versions tend to “push” each other. To show
the details of the structure, we show the positive and negative versions in separate
figures. Figures 10.5 and 10.6 show the negative and positive relationship ecosystem
of groups in that country. The negative edges show clearly the separation of bad
actors and good actors: radical groups such as GIA, GSPC, and AQIM on the left,
Chapter 10. Combining directed and signed embeddings
Name
pos-pos neg-neg
ROMUL
0.848
1.023
BONAVEN
0.247
0.000
AMBROSE
0.899
5.638
BERTH
1.609
1.994
PETER
2.026
10.851
LOUIS
0.747
3.710
VICTOR
1.037
3.372
WINF
0.978
0.696
JOHN
1.731
3.448
GREG
0.523
8.541
HUGH
0.367
3.399
BONI
0.691
5.964
MARK
0.877
2.957
ALBERT
0.544
5.195
AMAND
1.241
1.691
BASIL
0.654
5.921
ELIAS
0.854
3.315
SIMP
1.372
3.283
Means
0.958
3.944
STD
0.478
2.739
Table 10.1: Product of edge length and reciprocal of edge weight; deviations from
average indicate nodes with unusual neighborhoods
of these are pairs of groups that attack each other, and so are readily understood by
analysts. The embedded position of each node is determined by both the “pull” of
the other nodes to which it is connected positively, and the “push” of the other nodes
to which it is connected negatively, but both “pull” and “push” are directional, that
is asymmetric. The dotted edges represent the embedded positive and negative in-toout edges, respectively — the longer such an edge, the more net flow involving the
node.
Algeria
Figure 10.4 shows the two main axes of the embedding with the four versions of each
node. Positive versions tend to be close to the center because the positive versions
tend to “pull” each other and the negative versions tend to “push” each other. To show
the details of the structure, we show the positive and negative versions in separate
figures. Figures 10.5 and 10.6 show the negative and positive relationship ecosystem
of groups in that country. The negative edges show clearly the separation of bad
actors and good actors: radical groups such as GIA, GSPC, and AQIM on the left,