

10.2. Application to signed directed networks
143
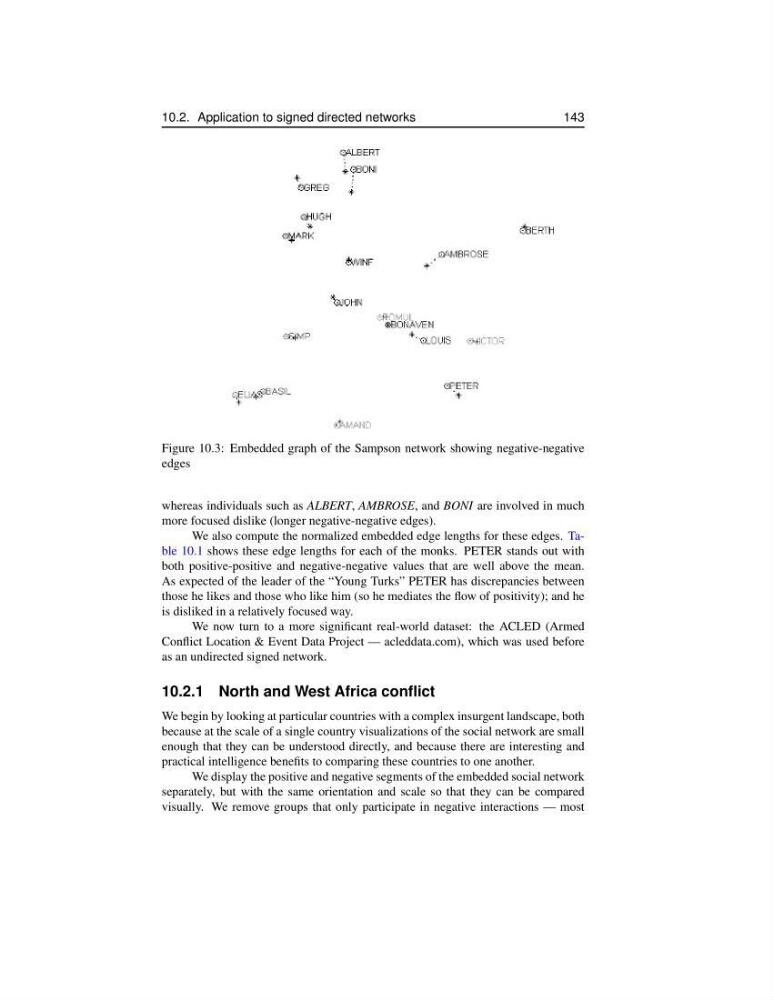
Figure 10.3: Embedded graph of the Sampson network showing negative-negative
edges
whereas individuals such as ALBERT, AMBROSE, and BONI are involved in much
more focused dislike (longer negative-negative edges).
We also compute the normalized embedded edge lengths for these edges. Table 10.1 shows these edge lengths for each of the monks. PETER stands out with
both positive-positive and negative-negative values that are well above the mean.
As expected of the leader of the “Young Turks” PETER has discrepancies between
those he likes and those who like him (so he mediates the flow of positivity); and he
is disliked in a relatively focused way.
We now turn to a more significant real-world dataset: the ACLED (Armed
Conflict Location & Event Data Project — acleddata.com), which was used before
as an undirected signed network.
10.2.1 North and West Africa conflict
We begin by looking at particular countries with a complex insurgent landscape, both
because at the scale of a single country visualizations of the social network are small
enough that they can be understood directly, and because there are interesting and
practical intelligence benefits to comparing these countries to one another.
We display the positive and negative segments of the embedded social network
separately, but with the same orientation and scale so that they can be compared
visually. We remove groups that only participate in negative interactions — most
143
Figure 10.3: Embedded graph of the Sampson network showing negative-negative
edges
whereas individuals such as ALBERT, AMBROSE, and BONI are involved in much
more focused dislike (longer negative-negative edges).
We also compute the normalized embedded edge lengths for these edges. Table 10.1 shows these edge lengths for each of the monks. PETER stands out with
both positive-positive and negative-negative values that are well above the mean.
As expected of the leader of the “Young Turks” PETER has discrepancies between
those he likes and those who like him (so he mediates the flow of positivity); and he
is disliked in a relatively focused way.
We now turn to a more significant real-world dataset: the ACLED (Armed
Conflict Location & Event Data Project — acleddata.com), which was used before
as an undirected signed network.
10.2.1 North and West Africa conflict
We begin by looking at particular countries with a complex insurgent landscape, both
because at the scale of a single country visualizations of the social network are small
enough that they can be understood directly, and because there are interesting and
practical intelligence benefits to comparing these countries to one another.
We display the positive and negative segments of the embedded social network
separately, but with the same orientation and scale so that they can be compared
visually. We remove groups that only participate in negative interactions — most