

114
Chapter 8. Modelling positive and negative relationships
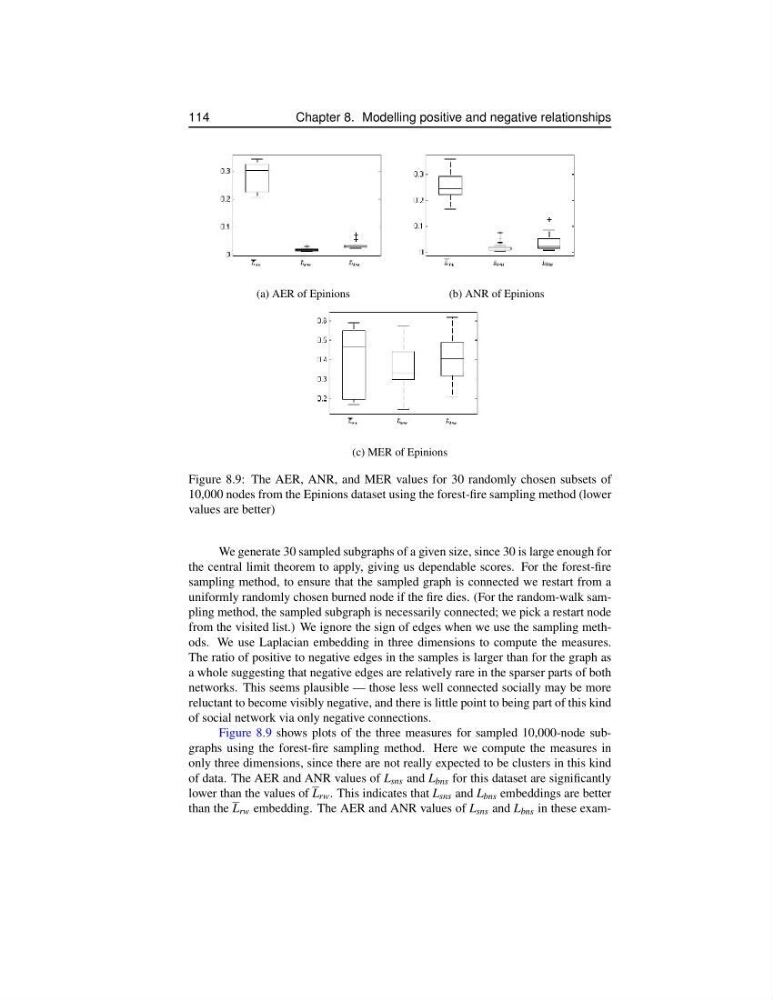
(a) AER of Epinions
(b) ANR of Epinions
(c) MER of Epinions
Figure 8.9: The AER, ANR, and MER values for 30 randomly chosen subsets of
10,000 nodes from the Epinions dataset using the forest-fire sampling method (lower
values are better)
We generate 30 sampled subgraphs of a given size, since 30 is large enough for
the central limit theorem to apply, giving us dependable scores. For the forest-fire
sampling method, to ensure that the sampled graph is connected we restart from a
uniformly randomly chosen burned node if the fire dies. (For the random-walk sampling method, the sampled subgraph is necessarily connected; we pick a restart node
from the visited list.) We ignore the sign of edges when we use the sampling methods. We use Laplacian embedding in three dimensions to compute the measures.
The ratio of positive to negative edges in the samples is larger than for the graph as
a whole suggesting that negative edges are relatively rare in the sparser parts of both
networks. This seems plausible — those less well connected socially may be more
reluctant to become visibly negative, and there is little point to being part of this kind
of social network via only negative connections.
Figure 8.9 shows plots of the three measures for sampled 10,000-node subgraphs using the forest-fire sampling method. Here we compute the measures in
only three dimensions, since there are not really expected to be clusters in this kind
of data. The AER and ANR values of L sns and L bns for this dataset are significantly
lower than the values of L rw . This indicates that L sns and L bns embeddings are better
than the L rw embedding. The AER and ANR values of L sns and L bns in these exam-
Chapter 8. Modelling positive and negative relationships
(a) AER of Epinions
(b) ANR of Epinions
(c) MER of Epinions
Figure 8.9: The AER, ANR, and MER values for 30 randomly chosen subsets of
10,000 nodes from the Epinions dataset using the forest-fire sampling method (lower
values are better)
We generate 30 sampled subgraphs of a given size, since 30 is large enough for
the central limit theorem to apply, giving us dependable scores. For the forest-fire
sampling method, to ensure that the sampled graph is connected we restart from a
uniformly randomly chosen burned node if the fire dies. (For the random-walk sampling method, the sampled subgraph is necessarily connected; we pick a restart node
from the visited list.) We ignore the sign of edges when we use the sampling methods. We use Laplacian embedding in three dimensions to compute the measures.
The ratio of positive to negative edges in the samples is larger than for the graph as
a whole suggesting that negative edges are relatively rare in the sparser parts of both
networks. This seems plausible — those less well connected socially may be more
reluctant to become visibly negative, and there is little point to being part of this kind
of social network via only negative connections.
Figure 8.9 shows plots of the three measures for sampled 10,000-node subgraphs using the forest-fire sampling method. Here we compute the measures in
only three dimensions, since there are not really expected to be clusters in this kind
of data. The AER and ANR values of L sns and L bns for this dataset are significantly
lower than the values of L rw . This indicates that L sns and L bns embeddings are better
than the L rw embedding. The AER and ANR values of L sns and L bns in these exam-