

271
Compact MOSFET Models for RF Applications
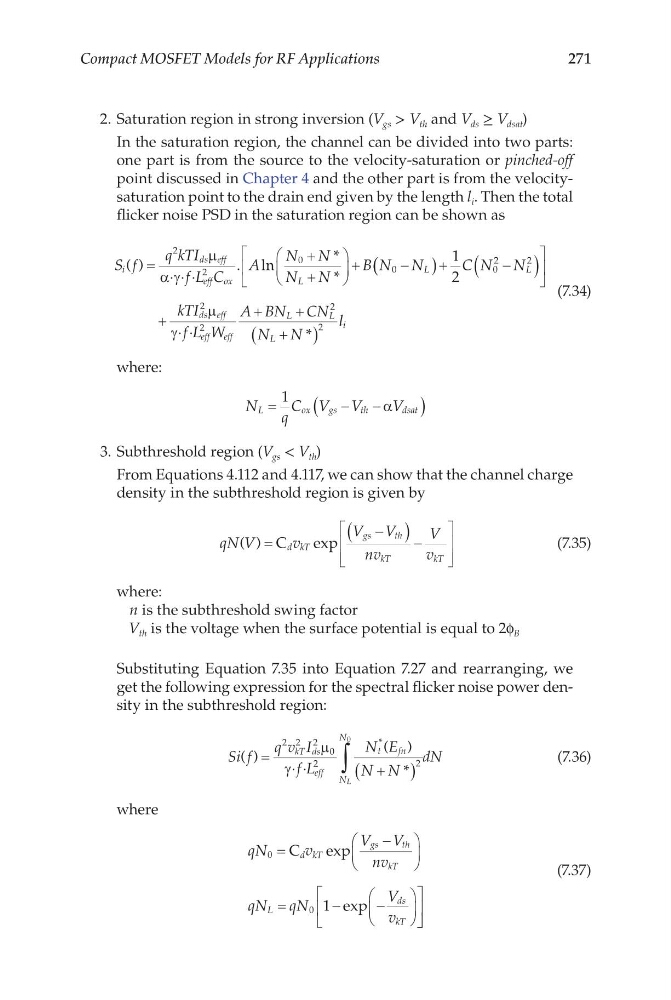
2. Saturation region in strong inversion (V gs > V th and V ds ≥ V dsat )
In the saturation region, the channel can be divided into two parts:
one part is from the source to the velocity-saturation or pinched-off
point discussed in Chapter 4 and the other part is from the velocitysaturation point to the drain end given by the length l i . Then the total
flicker noise PSD in the saturation region can be shown as
S f
q kTI
f L C
A
N N
N N
B N N
i
ds eff
eff ox
L
L
( )
. ln
*
*
= ⋅ ⋅ ⋅
+
+
+
−
2
2
0
0
µ
α γ
( (
)+
−
(
)
+ ⋅ ⋅
+
+
1
2
0
2
2
2
2
2
C N N
kTI
f L W
A BN CN
N
L
ds eff
eff eff
L
L
L
µ
γ
+ +
(
)
N
l i
*
2
(7.34)
where:
N
q
C V V
V
L
o x
g s
t h
d sat
=
−
−
(
)
1
α
3. Subthreshold region (V gs < V th )
From Equations 4.112 and 4.117, we can show that the channel charge
density in the subthreshold region is given by
qN V
v
V V
nv
V
v
d kT
gs
th
kT
kT
( )
exp
=
−
(
) −
C
(7.35)
where:
n is the subthreshold swing factor
V th is the voltage when the surface potential is equal to 2ϕ B
Substituting Equation 7.35 into Equation 7.27 and rearranging, we
get the following expression for the spectral flicker noise power density in the subthreshold region:
Si f
q v I
f L
N E
N N
dN
kT ds
eff
t
fn
N
N
L
( )
( )
*
*
= ⋅ ⋅
+
(
)
∫
2 2 2
0
2
2
0
µ
γ
(7.36)
where
qN
v
V V
nv
qN qN
V
v
d kT
gs
th
kT
L
ds
kT
0
0 1
=
−
=
−
−
C
exp
exp
(7.37)
Compact MOSFET Models for RF Applications
2. Saturation region in strong inversion (V gs > V th and V ds ≥ V dsat )
In the saturation region, the channel can be divided into two parts:
one part is from the source to the velocity-saturation or pinched-off
point discussed in Chapter 4 and the other part is from the velocitysaturation point to the drain end given by the length l i . Then the total
flicker noise PSD in the saturation region can be shown as
S f
q kTI
f L C
A
N N
N N
B N N
i
ds eff
eff ox
L
L
( )
. ln
*
*
= ⋅ ⋅ ⋅
+
+
+
−
2
2
0
0
µ
α γ
( (
)+
−
(
)
+ ⋅ ⋅
+
+
1
2
0
2
2
2
2
2
C N N
kTI
f L W
A BN CN
N
L
ds eff
eff eff
L
L
L
µ
γ
+ +
(
)
N
l i
*
2
(7.34)
where:
N
q
C V V
V
L
o x
g s
t h
d sat
=
−
−
(
)
1
α
3. Subthreshold region (V gs < V th )
From Equations 4.112 and 4.117, we can show that the channel charge
density in the subthreshold region is given by
qN V
v
V V
nv
V
v
d kT
gs
th
kT
kT
( )
exp
=
−
(
) −
C
(7.35)
where:
n is the subthreshold swing factor
V th is the voltage when the surface potential is equal to 2ϕ B
Substituting Equation 7.35 into Equation 7.27 and rearranging, we
get the following expression for the spectral flicker noise power density in the subthreshold region:
Si f
q v I
f L
N E
N N
dN
kT ds
eff
t
fn
N
N
L
( )
( )
*
*
= ⋅ ⋅
+
(
)
∫
2 2 2
0
2
2
0
µ
γ
(7.36)
where
qN
v
V V
nv
qN qN
V
v
d kT
gs
th
kT
L
ds
kT
0
0 1
=
−
=
−
−
C
exp
exp
(7.37)