

Counters and Registers
439
Table 11.7 Excitation table of a J-K flip-flop.
Present
Next state
J
K
state (Q n )
( Q n + 1 )
0
0
0
X
0
1
1
X
1
0
X
1
1
1
X
0
Table 11.8 Excitation table of a D flip-flop.
Present
Next state
D
state (Q n )
( Q n + 1 )
0
0
0
0
1
1
1
0
0
1
1
1
11.11.2 State Transition Diagram
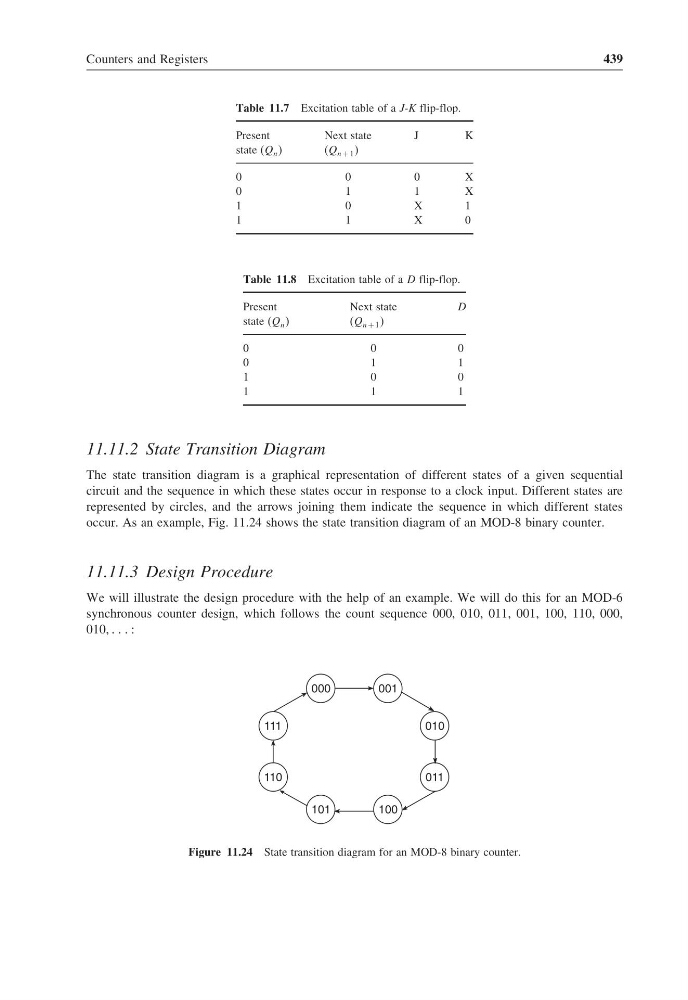
The state transition diagram is a graphical representation of different states of a given sequential
circuit and the sequence in which these states occur in response to a clock input. Different states are
represented by circles, and the arrows joining them indicate the sequence in which different states
occur. As an example, Fig. 11.24 shows the state transition diagram of an MOD-8 binary counter.
11.11.3 Design Procedure
We will illustrate the design procedure with the help of an example. We will do this for an MOD-6
synchronous counter design, which follows the count sequence 000, 010, 011, 001, 100, 110, 000,
010, :
000
001
101
100
111
110
010
011
Figure 11.24 State transition diagram for an MOD-8 binary counter.
439
Table 11.7 Excitation table of a J-K flip-flop.
Present
Next state
J
K
state (Q n )
( Q n + 1 )
0
0
0
X
0
1
1
X
1
0
X
1
1
1
X
0
Table 11.8 Excitation table of a D flip-flop.
Present
Next state
D
state (Q n )
( Q n + 1 )
0
0
0
0
1
1
1
0
0
1
1
1
11.11.2 State Transition Diagram
The state transition diagram is a graphical representation of different states of a given sequential
circuit and the sequence in which these states occur in response to a clock input. Different states are
represented by circles, and the arrows joining them indicate the sequence in which different states
occur. As an example, Fig. 11.24 shows the state transition diagram of an MOD-8 binary counter.
11.11.3 Design Procedure
We will illustrate the design procedure with the help of an example. We will do this for an MOD-6
synchronous counter design, which follows the count sequence 000, 010, 011, 001, 100, 110, 000,
010, :
000
001
101
100
111
110
010
011
Figure 11.24 State transition diagram for an MOD-8 binary counter.