

168
3.2 Comparison of the Selected Variables
From a general perspective, forests, wetlands and grasslands have received the
highest values in all of the three selected variables, while sparsely vegetated or
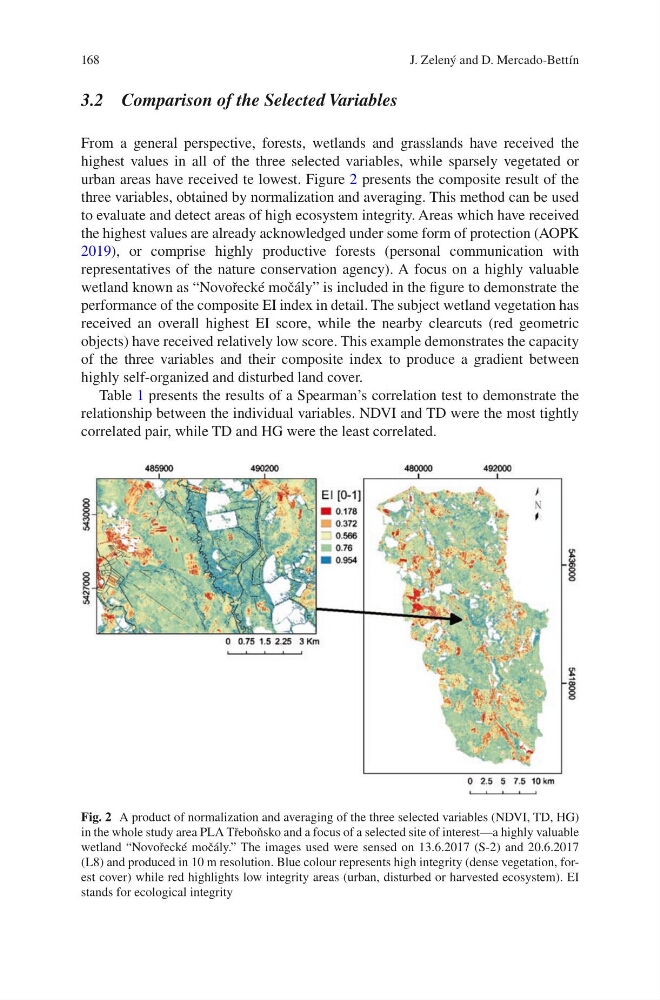
urban areas have received te lowest. Figure 2 presents the composite result of the
three variables, obtained by normalization and averaging. This method can be used
to evaluate and detect areas of high ecosystem integrity. Areas which have received
the highest values are already acknowledged under some form of protection (AOPK
2019), or comprise highly productive forests (personal communication with
representatives of the nature conservation agency). A focus on a highly valuable
wetland known as “Novořecké močály” is included in the figure to demonstrate the
performance of the composite EI index in detail. The subject wetland vegetation has
received an overall highest EI score, while the nearby clearcuts (red geometric
objects) have received relatively low score. This example demonstrates the capacity
of the three variables and their composite index to produce a gradient between
highly self-organized and disturbed land cover.
Table 1 presents the results of a Spearman’s correlation test to demonstrate the
relationship between the individual variables. NDVI and TD were the most tightly
correlated pair, while TD and HG were the least correlated.
Fig. 2 A product of normalization and averaging of the three selected variables (NDVI, TD, HG)
in the whole study area PLA Třeboňsko and a focus of a selected site of interest—a highly valuable
wetland “Novořecké močály.” The images used were sensed on 13.6.2017 (S-2) and 20.6.2017
(L8) and produced in 10 m resolution. Blue colour represents high integrity (dense vegetation, forest cover) while red highlights low integrity areas (urban, disturbed or harvested ecosystem). EI
stands for ecological integrity
J. Zelený and D. Mercado-Bettín
3.2 Comparison of the Selected Variables
From a general perspective, forests, wetlands and grasslands have received the
highest values in all of the three selected variables, while sparsely vegetated or
urban areas have received te lowest. Figure 2 presents the composite result of the
three variables, obtained by normalization and averaging. This method can be used
to evaluate and detect areas of high ecosystem integrity. Areas which have received
the highest values are already acknowledged under some form of protection (AOPK
2019), or comprise highly productive forests (personal communication with
representatives of the nature conservation agency). A focus on a highly valuable
wetland known as “Novořecké močály” is included in the figure to demonstrate the
performance of the composite EI index in detail. The subject wetland vegetation has
received an overall highest EI score, while the nearby clearcuts (red geometric
objects) have received relatively low score. This example demonstrates the capacity
of the three variables and their composite index to produce a gradient between
highly self-organized and disturbed land cover.
Table 1 presents the results of a Spearman’s correlation test to demonstrate the
relationship between the individual variables. NDVI and TD were the most tightly
correlated pair, while TD and HG were the least correlated.
Fig. 2 A product of normalization and averaging of the three selected variables (NDVI, TD, HG)
in the whole study area PLA Třeboňsko and a focus of a selected site of interest—a highly valuable
wetland “Novořecké močály.” The images used were sensed on 13.6.2017 (S-2) and 20.6.2017
(L8) and produced in 10 m resolution. Blue colour represents high integrity (dense vegetation, forest cover) while red highlights low integrity areas (urban, disturbed or harvested ecosystem). EI
stands for ecological integrity
J. Zelený and D. Mercado-Bettín