

169
4 Discussion
4.1 Indicator Design
The aim of this study was to design and validate suitable variables to represent a set
of selected ecological integrity indicators. Second part of the study was the design
of an appropriate aggregation method with the aim to provide a relative quantification of individual land-use types as well as the overall performance of the selected
region. Although the three tested variables are not new in landscape assessment
(Schneider and Kay 1994; Xu et al. 2012; Parrott 2010; Maes et al. 2011; Vargas
et al. 2017), the approach to use them in combination is novel.
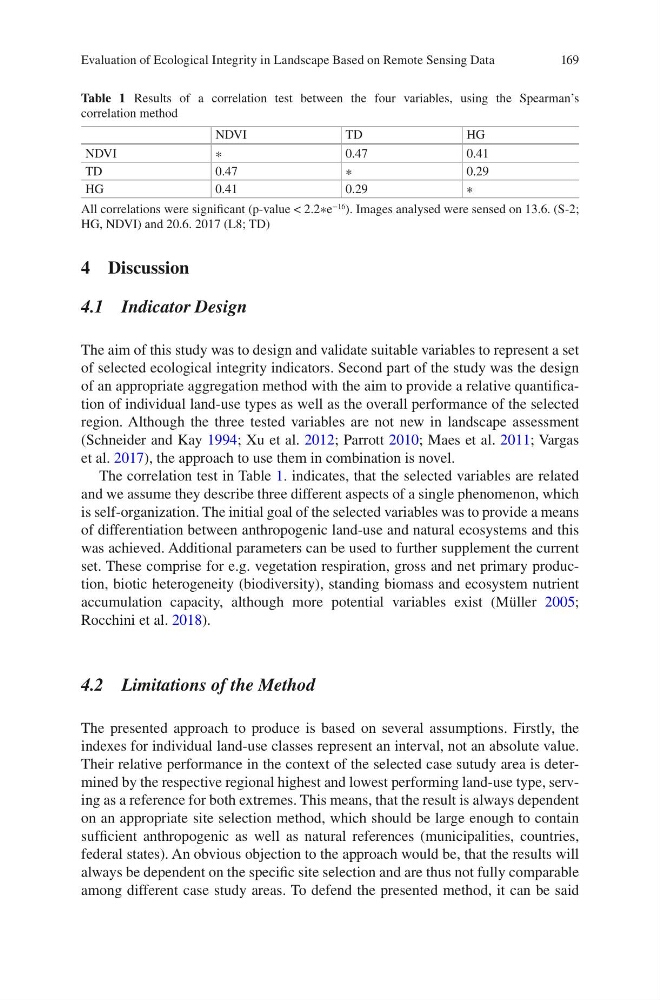
The correlation test in Table 1. indicates, that the selected variables are related
and we assume they describe three different aspects of a single phenomenon, which
is self-organization. The initial goal of the selected variables was to provide a means
of differentiation between anthropogenic land-use and natural ecosystems and this
was achieved. Additional parameters can be used to further supplement the current
set. These comprise for e.g. vegetation respiration, gross and net primary production, biotic heterogeneity (biodiversity), standing biomass and ecosystem nutrient
accumulation capacity, although more potential variables exist (Müller 2005;
Rocchini et al. 2018).
4.2 Limitations of the Method
The presented approach to produce is based on several assumptions. Firstly, the
indexes for individual land-use classes represent an interval, not an absolute value.
Their relative performance in the context of the selected case sutudy area is determined by the respective regional highest and lowest performing land-use type, serving as a reference for both extremes. This means, that the result is always dependent
on an appropriate site selection method, which should be large enough to contain
sufficient anthropogenic as well as natural references (municipalities, countries,
federal states). An obvious objection to the approach would be, that the results will
always be dependent on the specific site selection and are thus not fully comparable
among different case study areas. To defend the presented method, it can be said
Table 1 Results of a correlation test between the four variables, using the Spearman’s
correlation method
NDVI
TD
HG
NDVI
∗
0.47
0.41
TD
0.47
∗
0.29
HG
0.41
0.29
∗
All correlations were significant (p-value < 2.2∗e
−16
). Images analysed were sensed on 13.6. (S-2;
HG, NDVI) and 20.6. 2017 (L8; TD)
Evaluation of Ecological Integrity in Landscape Based on Remote Sensing Data
4 Discussion
4.1 Indicator Design
The aim of this study was to design and validate suitable variables to represent a set
of selected ecological integrity indicators. Second part of the study was the design
of an appropriate aggregation method with the aim to provide a relative quantification of individual land-use types as well as the overall performance of the selected
region. Although the three tested variables are not new in landscape assessment
(Schneider and Kay 1994; Xu et al. 2012; Parrott 2010; Maes et al. 2011; Vargas
et al. 2017), the approach to use them in combination is novel.
The correlation test in Table 1. indicates, that the selected variables are related
and we assume they describe three different aspects of a single phenomenon, which
is self-organization. The initial goal of the selected variables was to provide a means
of differentiation between anthropogenic land-use and natural ecosystems and this
was achieved. Additional parameters can be used to further supplement the current
set. These comprise for e.g. vegetation respiration, gross and net primary production, biotic heterogeneity (biodiversity), standing biomass and ecosystem nutrient
accumulation capacity, although more potential variables exist (Müller 2005;
Rocchini et al. 2018).
4.2 Limitations of the Method
The presented approach to produce is based on several assumptions. Firstly, the
indexes for individual land-use classes represent an interval, not an absolute value.
Their relative performance in the context of the selected case sutudy area is determined by the respective regional highest and lowest performing land-use type, serving as a reference for both extremes. This means, that the result is always dependent
on an appropriate site selection method, which should be large enough to contain
sufficient anthropogenic as well as natural references (municipalities, countries,
federal states). An obvious objection to the approach would be, that the results will
always be dependent on the specific site selection and are thus not fully comparable
among different case study areas. To defend the presented method, it can be said
Table 1 Results of a correlation test between the four variables, using the Spearman’s
correlation method
NDVI
TD
HG
NDVI
∗
0.47
0.41
TD
0.47
∗
0.29
HG
0.41
0.29
∗
All correlations were significant (p-value < 2.2∗e
−16
). Images analysed were sensed on 13.6. (S-2;
HG, NDVI) and 20.6. 2017 (L8; TD)
Evaluation of Ecological Integrity in Landscape Based on Remote Sensing Data