

167
3 Results
3.1 Ecological Integrity of Variable Land-Use
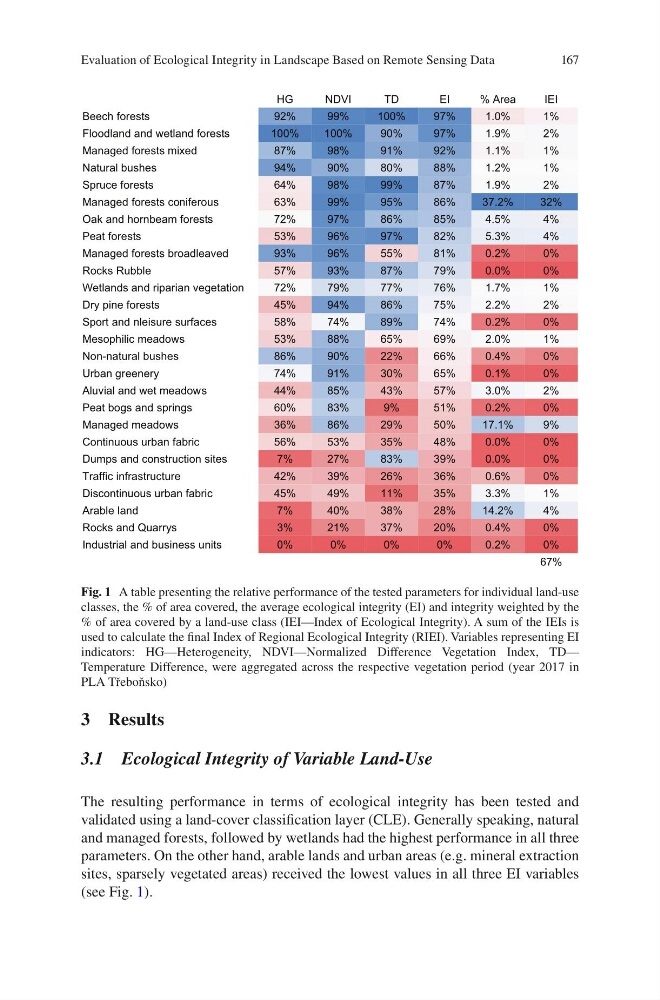
The resulting performance in terms of ecological integrity has been tested and
validated using a land-cover classification layer (CLE). Generally speaking, natural
and managed forests, followed by wetlands had the highest performance in all three
parameters. On the other hand, arable lands and urban areas (e.g. mineral extraction
sites, sparsely vegetated areas) received the lowest values in all three EI variables
(see Fig. 1).
HG
NDVI
T D
E I
% Area
IEI
Beech forests
92%
99%
100%
97%
1.0%
1%
Floodland and wetland forests
100%
100%
90%
97%
1.9%
2%
Managed forests mixed
87%
98%
91%
92%
1.1%
1%
Natural bushes
94%
90%
80%
88%
1.2%
1%
Spruce forests
64%
98%
99%
87%
1.9%
2%
Managed forests coniferous
63%
99%
95%
86%
37.2%
32%
Oak and hornbeam forests
72%
97%
86%
85%
4.5%
4%
Peat forests
53%
96%
97%
82%
5.3%
4%
Managed forests broadleaved
93%
96%
55%
81%
0.2%
0%
Rocks Rubble
57%
93%
87%
79%
0.0%
0%
Wetlands and riparian vegetation
72%
79%
77%
76%
1.7%
1%
Dry pine forests
45%
94%
86%
75%
2.2%
2%
Sport and nleisure surfaces
58%
74%
89%
74%
0.2%
0%
Mesophilic meadows
53%
88%
65%
69%
2.0%
1%
Non-natural bushes
86%
90%
22%
66%
0.4%
0%
Urban greenery
74%
91%
30%
65%
0.1%
0%
Aluvial and wet meadows
44%
85%
43%
57%
3.0%
2%
Peat bogs and springs
60%
83%
9%
51%
0.2%
0%
Managed meadows
36%
86%
29%
50%
17.1%
9%
Continuous urban fabric
56%
53%
35%
48%
0.0%
0%
Dumps and construction sites
7%
27%
83%
39%
0.0%
0%
Traffic infrastructure
42%
39%
26%
36%
0.6%
0%
Discontinuous urban fabric
45%
49%
11%
35%
3.3%
1%
Arable land
7%
40%
38%
28%
14.2%
4%
Rocks and Quarrys
3%
21%
37%
20%
0.4%
0%
Industrial and business units
0%
0%
0%
0%
0.2%
0%
67%
Fig. 1 A table presenting the relative performance of the tested parameters for individual land-use
classes, the % of area covered, the average ecological integrity (EI) and integrity weighted by the
% of area covered by a land-use class (IEI—Index of Ecological Integrity). A sum of the IEIs is
used to calculate the final Index of Regional Ecological Integrity (RIEI). Variables representing EI
indicators: HG—Heterogeneity, NDVI—Normalized Difference Vegetation Index, TD—
Temperature Difference, were aggregated across the respective vegetation period (year 2017 in
PLA Třeboňsko)
Evaluation of Ecological Integrity in Landscape Based on Remote Sensing Data
3 Results
3.1 Ecological Integrity of Variable Land-Use
The resulting performance in terms of ecological integrity has been tested and
validated using a land-cover classification layer (CLE). Generally speaking, natural
and managed forests, followed by wetlands had the highest performance in all three
parameters. On the other hand, arable lands and urban areas (e.g. mineral extraction
sites, sparsely vegetated areas) received the lowest values in all three EI variables
(see Fig. 1).
HG
NDVI
T D
E I
% Area
IEI
Beech forests
92%
99%
100%
97%
1.0%
1%
Floodland and wetland forests
100%
100%
90%
97%
1.9%
2%
Managed forests mixed
87%
98%
91%
92%
1.1%
1%
Natural bushes
94%
90%
80%
88%
1.2%
1%
Spruce forests
64%
98%
99%
87%
1.9%
2%
Managed forests coniferous
63%
99%
95%
86%
37.2%
32%
Oak and hornbeam forests
72%
97%
86%
85%
4.5%
4%
Peat forests
53%
96%
97%
82%
5.3%
4%
Managed forests broadleaved
93%
96%
55%
81%
0.2%
0%
Rocks Rubble
57%
93%
87%
79%
0.0%
0%
Wetlands and riparian vegetation
72%
79%
77%
76%
1.7%
1%
Dry pine forests
45%
94%
86%
75%
2.2%
2%
Sport and nleisure surfaces
58%
74%
89%
74%
0.2%
0%
Mesophilic meadows
53%
88%
65%
69%
2.0%
1%
Non-natural bushes
86%
90%
22%
66%
0.4%
0%
Urban greenery
74%
91%
30%
65%
0.1%
0%
Aluvial and wet meadows
44%
85%
43%
57%
3.0%
2%
Peat bogs and springs
60%
83%
9%
51%
0.2%
0%
Managed meadows
36%
86%
29%
50%
17.1%
9%
Continuous urban fabric
56%
53%
35%
48%
0.0%
0%
Dumps and construction sites
7%
27%
83%
39%
0.0%
0%
Traffic infrastructure
42%
39%
26%
36%
0.6%
0%
Discontinuous urban fabric
45%
49%
11%
35%
3.3%
1%
Arable land
7%
40%
38%
28%
14.2%
4%
Rocks and Quarrys
3%
21%
37%
20%
0.4%
0%
Industrial and business units
0%
0%
0%
0%
0.2%
0%
67%
Fig. 1 A table presenting the relative performance of the tested parameters for individual land-use
classes, the % of area covered, the average ecological integrity (EI) and integrity weighted by the
% of area covered by a land-use class (IEI—Index of Ecological Integrity). A sum of the IEIs is
used to calculate the final Index of Regional Ecological Integrity (RIEI). Variables representing EI
indicators: HG—Heterogeneity, NDVI—Normalized Difference Vegetation Index, TD—
Temperature Difference, were aggregated across the respective vegetation period (year 2017 in
PLA Třeboňsko)
Evaluation of Ecological Integrity in Landscape Based on Remote Sensing Data