

166
2.3.5 Land-Use Integrity Estimation
In order to represent the temporal performance of each variable in the respective
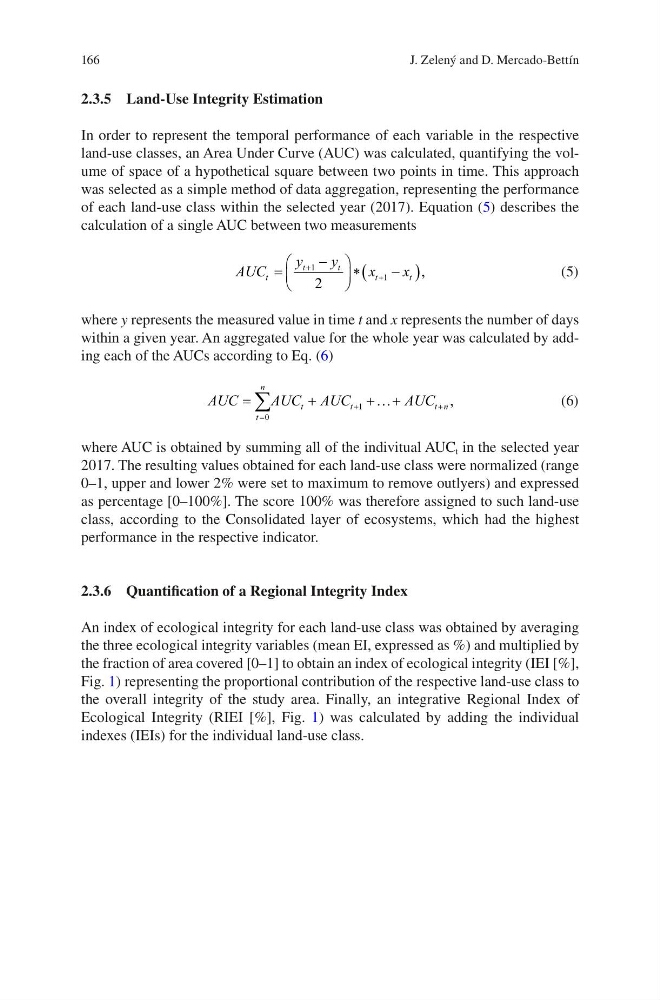
land-use classes, an Area Under Curve (AUC) was calculated, quantifying the volume of space of a hypothetical square between two points in time. This approach
was selected as a simple method of data aggregation, representing the performance
of each land-use class within the selected year (2017). Equation (5) describes the
calculation of a single AUC between two measurements
AUC
y
y
x
x
t
t
t
t
t
§
©
¨
·
¹
¸
1
1
2
,
(5)
where y represents the measured value in time t and x represents the number of days
within a given year. An aggregated value for the whole year was calculated by adding each of the AUCs according to Eq. (6)
AUC
AUC AUC
A UC
t
n
t
t
t n
}
¦
0
1
,
(6)
where AUC is obtained by summing all of the indivitual AUC t in the selected year
2017. The resulting values obtained for each land-use class were normalized (range
0–1, upper and lower 2% were set to maximum to remove outlyers) and expressed
as percentage [0–100%]. The score 100% was therefore assigned to such land-use
class, according to the Consolidated layer of ecosystems, which had the highest
performance in the respective indicator.
2.3.6 Quantification of a Regional Integrity Index
An index of ecological integrity for each land-use class was obtained by averaging
the three ecological integrity variables (mean EI, expressed as %) and multiplied by
the fraction of area covered [0–1] to obtain an index of ecological integrity (IEI [%],
Fig. 1) representing the proportional contribution of the respective land-use class to
the overall integrity of the study area. Finally, an integrative Regional Index of
Ecological Integrity (RIEI [%], Fig. 1) was calculated by adding the individual
indexes (IEIs) for the individual land-use class.
J. Zelený and D. Mercado-Bettín
2.3.5 Land-Use Integrity Estimation
In order to represent the temporal performance of each variable in the respective
land-use classes, an Area Under Curve (AUC) was calculated, quantifying the volume of space of a hypothetical square between two points in time. This approach
was selected as a simple method of data aggregation, representing the performance
of each land-use class within the selected year (2017). Equation (5) describes the
calculation of a single AUC between two measurements
AUC
y
y
x
x
t
t
t
t
t
§
©
¨
·
¹
¸
1
1
2
,
(5)
where y represents the measured value in time t and x represents the number of days
within a given year. An aggregated value for the whole year was calculated by adding each of the AUCs according to Eq. (6)
AUC
AUC AUC
A UC
t
n
t
t
t n
}
¦
0
1
,
(6)
where AUC is obtained by summing all of the indivitual AUC t in the selected year
2017. The resulting values obtained for each land-use class were normalized (range
0–1, upper and lower 2% were set to maximum to remove outlyers) and expressed
as percentage [0–100%]. The score 100% was therefore assigned to such land-use
class, according to the Consolidated layer of ecosystems, which had the highest
performance in the respective indicator.
2.3.6 Quantification of a Regional Integrity Index
An index of ecological integrity for each land-use class was obtained by averaging
the three ecological integrity variables (mean EI, expressed as %) and multiplied by
the fraction of area covered [0–1] to obtain an index of ecological integrity (IEI [%],
Fig. 1) representing the proportional contribution of the respective land-use class to
the overall integrity of the study area. Finally, an integrative Regional Index of
Ecological Integrity (RIEI [%], Fig. 1) was calculated by adding the individual
indexes (IEIs) for the individual land-use class.
J. Zelený and D. Mercado-Bettín