

165
BT was further converted from an absolute temperature to a range in °C (upper
and lower 2% were clipped to remove outliers) and inverted to represent the capacity of vegetation to reduce surface temperature, without the information on seasonal
variation of temperature. The resulting variable is termed TD (Temperature
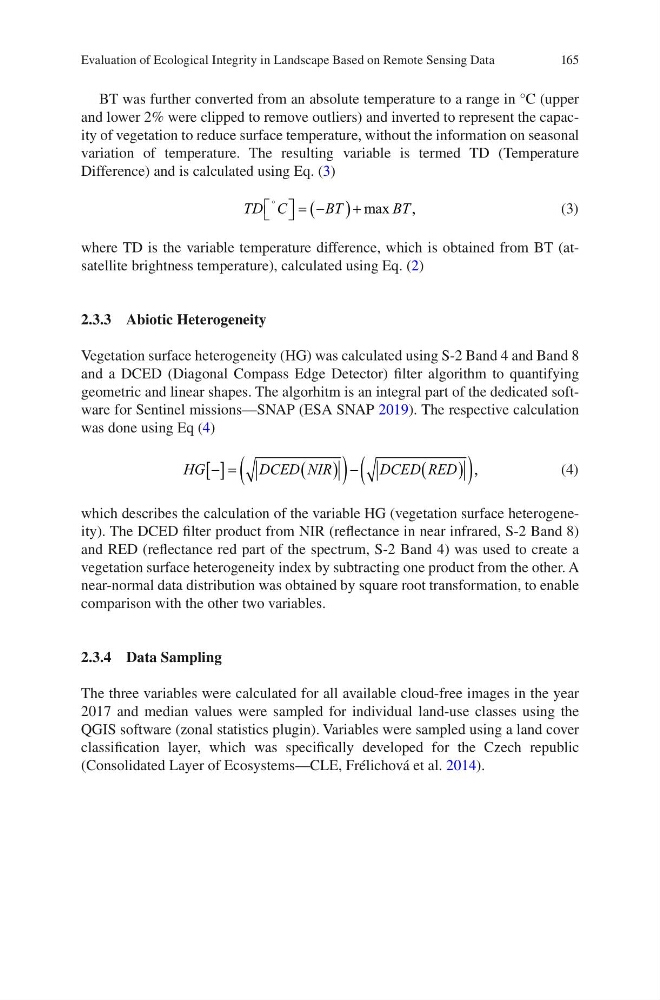
Difference) and is calculated using Eq. (3)
TD C
BT
B T
q
ª ¬ º ¼
max ,
(3)
where TD is the variable temperature difference, which is obtained from BT (atsatellite brightness temperature), calculated using Eq. (2)
2.3.3 Abiotic Heterogeneity
Vegetation surface heterogeneity (HG) was calculated using S-2 Band 4 and Band 8
and a DCED (Diagonal Compass Edge Detector) filter algorithm to quantifying
geometric and linear shapes. The algorhitm is an integral part of the dedicated software for Sentinel missions—SNAP (ESA SNAP 2019). The respective calculation
was done using Eq (4)
HG
DCED NIR
D CED RED
> @
,
(4)
which describes the calculation of the variable HG (vegetation surface heterogeneity). The DCED filter product from NIR (reflectance in near infrared, S-2 Band 8)
and RED (reflectance red part of the spectrum, S-2 Band 4) was used to create a
vegetation surface heterogeneity index by subtracting one product from the other. A
near-normal data distribution was obtained by square root transformation, to enable
comparison with the other two variables.
2.3.4 Data Sampling
The three variables were calculated for all available cloud-free images in the year
2017 and median values were sampled for individual land-use classes using the
QGIS software (zonal statistics plugin). Variables were sampled using a land cover
classification layer, which was specifically developed for the Czech republic
(Consolidated Layer of Ecosystems—CLE, Frélichová et al. 2014).
Evaluation of Ecological Integrity in Landscape Based on Remote Sensing Data
BT was further converted from an absolute temperature to a range in °C (upper
and lower 2% were clipped to remove outliers) and inverted to represent the capacity of vegetation to reduce surface temperature, without the information on seasonal
variation of temperature. The resulting variable is termed TD (Temperature
Difference) and is calculated using Eq. (3)
TD C
BT
B T
q
ª ¬ º ¼
max ,
(3)
where TD is the variable temperature difference, which is obtained from BT (atsatellite brightness temperature), calculated using Eq. (2)
2.3.3 Abiotic Heterogeneity
Vegetation surface heterogeneity (HG) was calculated using S-2 Band 4 and Band 8
and a DCED (Diagonal Compass Edge Detector) filter algorithm to quantifying
geometric and linear shapes. The algorhitm is an integral part of the dedicated software for Sentinel missions—SNAP (ESA SNAP 2019). The respective calculation
was done using Eq (4)
HG
DCED NIR
D CED RED
> @
,
(4)
which describes the calculation of the variable HG (vegetation surface heterogeneity). The DCED filter product from NIR (reflectance in near infrared, S-2 Band 8)
and RED (reflectance red part of the spectrum, S-2 Band 4) was used to create a
vegetation surface heterogeneity index by subtracting one product from the other. A
near-normal data distribution was obtained by square root transformation, to enable
comparison with the other two variables.
2.3.4 Data Sampling
The three variables were calculated for all available cloud-free images in the year
2017 and median values were sampled for individual land-use classes using the
QGIS software (zonal statistics plugin). Variables were sampled using a land cover
classification layer, which was specifically developed for the Czech republic
(Consolidated Layer of Ecosystems—CLE, Frélichová et al. 2014).
Evaluation of Ecological Integrity in Landscape Based on Remote Sensing Data