

164
has a 16 day revisit time). Unlike S-2, L8 carries a thermal sensor (TIRS - Thermal
InfraRed Sensor) which is why the two satellites were combined to deliver a complementary set of vegetation measurements.
2.3 Data Sources and Processing
The three selected indicators of ecological integrity (exergy capture, biotic water
flows and abiotic heterogenity) are represented by three respective variables:
Normalized Difference Vegetation Index (NDVI), at-satellite brightness temperature (BT) and vegetation surface heterogeneity (HG). NDVI and HG was derived
from S-2 images, while BT was obtained from L8.
2.3.1 Exergy Capture
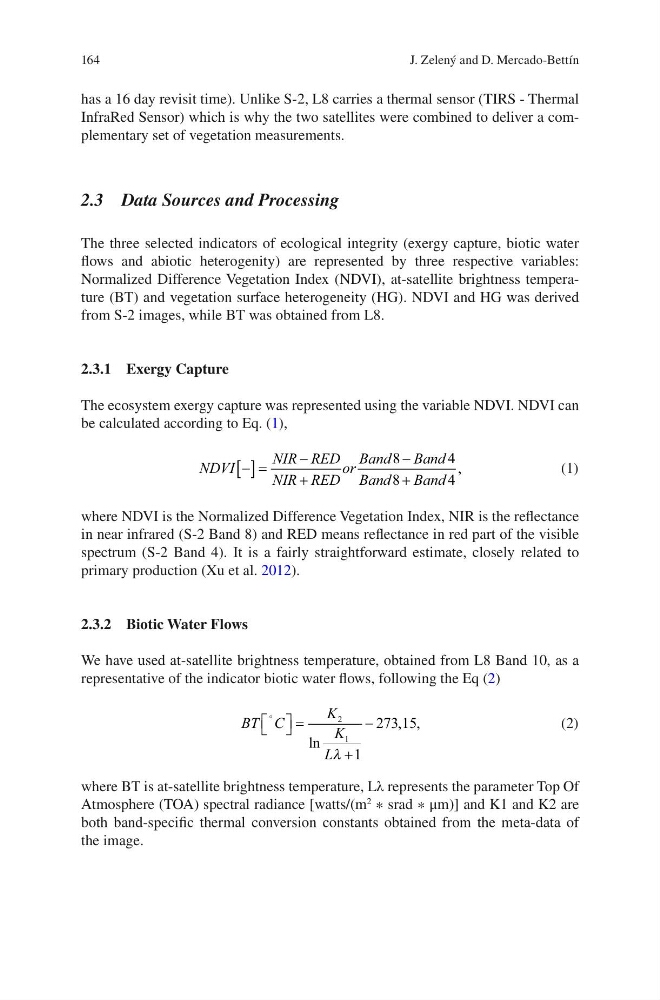
The ecosystem exergy capture was represented using the variable NDVI. NDVI can
be calculated according to Eq. (1),
NDVI
NIR RED
NIR RED
or
Band
Band
Band
Band
> @
8
4
8
4
,
(1)
where NDVI is the Normalized Difference Vegetation Index, NIR is the reflectance
in near infrared (S-2 Band 8) and RED means reflectance in red part of the visible
spectrum (S-2 Band 4). It is a fairly straightforward estimate, closely related to
primary production (Xu et al. 2012).
2.3.2 Biotic Water Flows
We have used at-satellite brightness temperature, obtained from L8 Band 10, as a
representative of the indicator biotic water flows, following the Eq (2)
BT C
K
K
L
q
ª ¬ º ¼
2
1
1
273 15
ln
,
O
,
(2)
where BT is at-satellite brightness temperature, Lλ represents the parameter Top Of
Atmosphere (TOA) spectral radiance [watts/(m
2
∗ srad ∗ μm)] and K1 and K2 are
both band-specific thermal conversion constants obtained from the meta-data of
the image.
J. Zelený and D. Mercado-Bettín
has a 16 day revisit time). Unlike S-2, L8 carries a thermal sensor (TIRS - Thermal
InfraRed Sensor) which is why the two satellites were combined to deliver a complementary set of vegetation measurements.
2.3 Data Sources and Processing
The three selected indicators of ecological integrity (exergy capture, biotic water
flows and abiotic heterogenity) are represented by three respective variables:
Normalized Difference Vegetation Index (NDVI), at-satellite brightness temperature (BT) and vegetation surface heterogeneity (HG). NDVI and HG was derived
from S-2 images, while BT was obtained from L8.
2.3.1 Exergy Capture
The ecosystem exergy capture was represented using the variable NDVI. NDVI can
be calculated according to Eq. (1),
NDVI
NIR RED
NIR RED
or
Band
Band
Band
Band
> @
8
4
8
4
,
(1)
where NDVI is the Normalized Difference Vegetation Index, NIR is the reflectance
in near infrared (S-2 Band 8) and RED means reflectance in red part of the visible
spectrum (S-2 Band 4). It is a fairly straightforward estimate, closely related to
primary production (Xu et al. 2012).
2.3.2 Biotic Water Flows
We have used at-satellite brightness temperature, obtained from L8 Band 10, as a
representative of the indicator biotic water flows, following the Eq (2)
BT C
K
K
L
q
ª ¬ º ¼
2
1
1
273 15
ln
,
O
,
(2)
where BT is at-satellite brightness temperature, Lλ represents the parameter Top Of
Atmosphere (TOA) spectral radiance [watts/(m
2
∗ srad ∗ μm)] and K1 and K2 are
both band-specific thermal conversion constants obtained from the meta-data of
the image.
J. Zelený and D. Mercado-Bettín