

82 Basic Seismological Theory
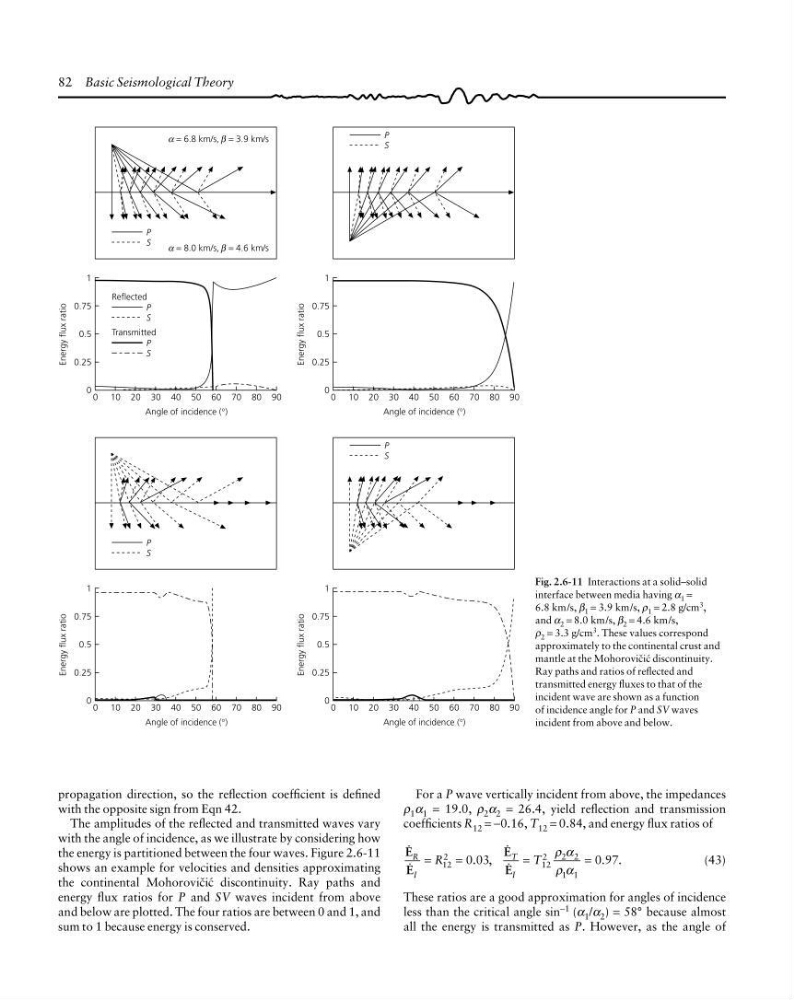
Fig. 2.6-11 Interactions at a solid–solid
interface between media having α 1 =
6.8 km/s, β 1 = 3.9 km/s, ρ 1 = 2.8 g/cm
3 ,
and α 2 = 8.0 km/s, β 2 = 4.6 km/s,
ρ 2 = 3.3 g/cm 3 . These values correspond
approximately to the continental crust and
mantle at the Mohorovibia discontinuity.
Ray paths and ratios of reflected and
transmitted energy fluxes to that of the
incident wave are shown as a function
of incidence angle for P and SV waves
incident from above and below.
propagation direction, so the reflection coefficient is defined
with the opposite sign from Eqn 42.
The amplitudes of the reflected and transmitted waves vary
with the angle of incidence, as we illustrate by considering how
the energy is partitioned between the four waves. Figure 2.6-11
shows an example for velocities and densities approximating
the continental Mohorovibia discontinuity. Ray paths and
energy flux ratios for P and SV waves incident from above
and below are plotted. The four ratios are between 0 and 1, and
sum to 1 because energy is conserved.
For a P wave vertically incident from above, the impedances
ρ 1 α 1 = 19.0, ρ 2 α 2 = 26.4, yield reflection and transmission
coefficients R 12 = −0.16, T 12 = 0.84, and energy flux ratios of
0
0
0
0
R
I
T
I
R
T
. ,
. .
=
=
=
=
12
2
12
2
2 2
1 1
0 03
0 97
ρ α
ρ α
(43)
These ratios are a good approximation for angles of incidence
less than the critical angle sin −1 (α 1 /α 2 ) = 58° because almost
all the energy is transmitted as P. However, as the angle of
Energy flux ratio
1
0.75
0.5
0.25
0
90
P
S
Reflected
P
S
Transmitted
80
70
60
50
40
30
20
10
0
Angle of incidence (°)
Energy flux ratio
1
0.75
0.5
0.25
0
90
80
70
60
50
40
30
20
10
0
Angle of incidence (°)
P
S
= 8.0 km/s, = 4.6 km/s
α
β
= 6.8 km/s, = 3.9 km/s
α
β
P
S
Energy flux ratio
1
0.75
0.5
0.25
0
90
80
70
60
50
40
30
20
10
0
Angle of incidence (°)
Energy flux ratio
1
0.75
0.5
0.25
0
90
80
70
60
50
40
30
20
10
0
Angle of incidence (°)
P
S
P
S
Fig. 2.6-11 Interactions at a solid–solid
interface between media having α 1 =
6.8 km/s, β 1 = 3.9 km/s, ρ 1 = 2.8 g/cm
3 ,
and α 2 = 8.0 km/s, β 2 = 4.6 km/s,
ρ 2 = 3.3 g/cm 3 . These values correspond
approximately to the continental crust and
mantle at the Mohorovibia discontinuity.
Ray paths and ratios of reflected and
transmitted energy fluxes to that of the
incident wave are shown as a function
of incidence angle for P and SV waves
incident from above and below.
propagation direction, so the reflection coefficient is defined
with the opposite sign from Eqn 42.
The amplitudes of the reflected and transmitted waves vary
with the angle of incidence, as we illustrate by considering how
the energy is partitioned between the four waves. Figure 2.6-11
shows an example for velocities and densities approximating
the continental Mohorovibia discontinuity. Ray paths and
energy flux ratios for P and SV waves incident from above
and below are plotted. The four ratios are between 0 and 1, and
sum to 1 because energy is conserved.
For a P wave vertically incident from above, the impedances
ρ 1 α 1 = 19.0, ρ 2 α 2 = 26.4, yield reflection and transmission
coefficients R 12 = −0.16, T 12 = 0.84, and energy flux ratios of
0
0
0
0
R
I
T
I
R
T
. ,
. .
=
=
=
=
12
2
12
2
2 2
1 1
0 03
0 97
ρ α
ρ α
(43)
These ratios are a good approximation for angles of incidence
less than the critical angle sin −1 (α 1 /α 2 ) = 58° because almost
all the energy is transmitted as P. However, as the angle of
Energy flux ratio
1
0.75
0.5
0.25
0
90
P
S
Reflected
P
S
Transmitted
80
70
60
50
40
30
20
10
0
Angle of incidence (°)
Energy flux ratio
1
0.75
0.5
0.25
0
90
80
70
60
50
40
30
20
10
0
Angle of incidence (°)
P
S
= 8.0 km/s, = 4.6 km/s
α
β
= 6.8 km/s, = 3.9 km/s
α
β
P
S
Energy flux ratio
1
0.75
0.5
0.25
0
90
80
70
60
50
40
30
20
10
0
Angle of incidence (°)
Energy flux ratio
1
0.75
0.5
0.25
0
90
80
70
60
50
40
30
20
10
0
Angle of incidence (°)
P
S
P
S