

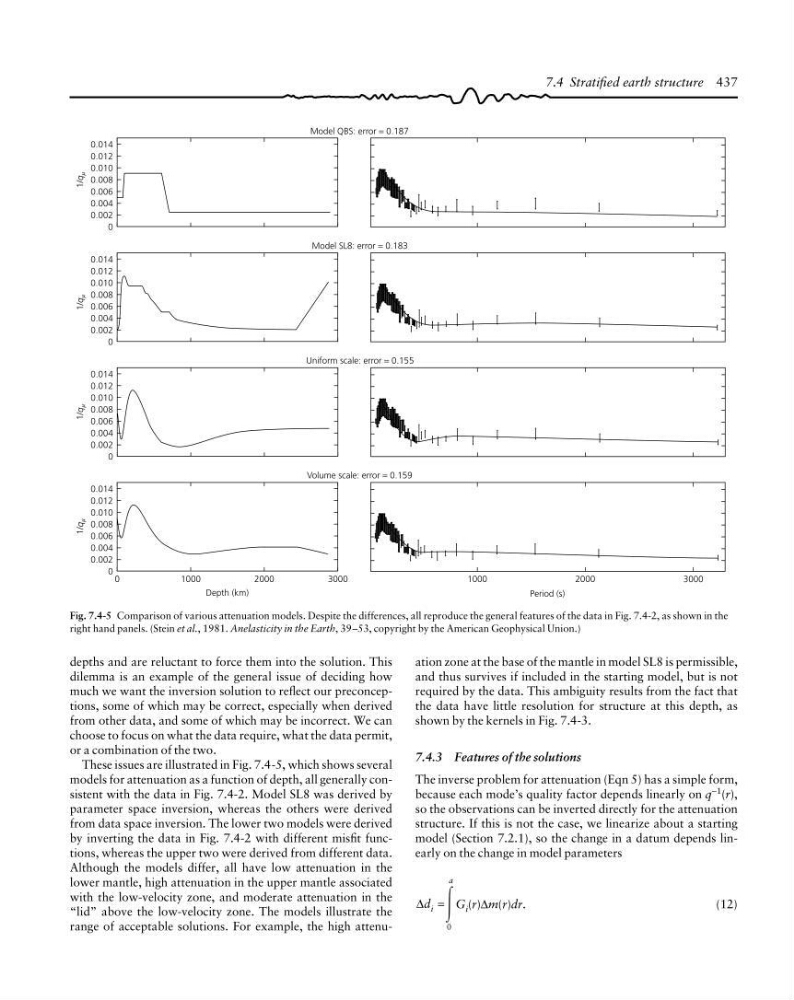
ation zone at the base of the mantle in model SL8 is permissible,
and thus survives if included in the starting model, but is not
required by the data. This ambiguity results from the fact that
the data have little resolution for structure at this depth, as
shown by the kernels in Fig. 7.4-3.
7.4.3 Features of the solutions
The inverse problem for attenuation (Eqn 5) has a simple form,
because each mode’s quality factor depends linearly on q −1 (r),
so the observations can be inverted directly for the attenuation
structure. If this is not the case, we linearize about a starting
model (Section 7.2.1), so the change in a datum depends linearly on the change in model parameters
∆d i
a
=
Ύ
0
G i (r)∆m(r)dr.
(12)
0.014
0.012
0.010
0.008
0.006
0.004
0.002
0
Model QBS: error = 0.187
0.014
0.012
0.010
0.008
0.006
0.004
0.002
0
Model SL8: error = 0.183
0.014
0.012
0.010
0.008
0.006
0.004
0.002
0
Uniform scale: error = 0.155
0.014
0.012
0.010
0.008
0.006
0.004
0.002
0
Volume scale: error = 0.159
0
1000
2000
3000
Depth (km)
1000
2000
3000
Period (s)
1/q
µ
1/q
µ
1/q
µ
1/q
µ
Fig. 7.4-5 Comparison of various attenuation models. Despite the differences, all reproduce the general features of the data in Fig. 7.4-2, as shown in the
right hand panels. (Stein et al., 1981. Anelasticity in the Earth, 39–53, copyright by the American Geophysical Union.)
depths and are reluctant to force them into the solution. This
dilemma is an example of the general issue of deciding how
much we want the inversion solution to reflect our preconceptions, some of which may be correct, especially when derived
from other data, and some of which may be incorrect. We can
choose to focus on what the data require, what the data permit,
or a combination of the two.
These issues are illustrated in Fig. 7.4-5, which shows several
models for attenuation as a function of depth, all generally consistent with the data in Fig. 7.4-2. Model SL8 was derived by
parameter space inversion, whereas the others were derived
from data space inversion. The lower two models were derived
by inverting the data in Fig. 7.4-2 with different misfit functions, whereas the upper two were derived from different data.
Although the models differ, all have low attenuation in the
lower mantle, high attenuation in the upper mantle associated
with the low-velocity zone, and moderate attenuation in the
“lid” above the low-velocity zone. The models illustrate the
range of acceptable solutions. For example, the high attenu7.4 Stratified earth structure 437
and thus survives if included in the starting model, but is not
required by the data. This ambiguity results from the fact that
the data have little resolution for structure at this depth, as
shown by the kernels in Fig. 7.4-3.
7.4.3 Features of the solutions
The inverse problem for attenuation (Eqn 5) has a simple form,
because each mode’s quality factor depends linearly on q −1 (r),
so the observations can be inverted directly for the attenuation
structure. If this is not the case, we linearize about a starting
model (Section 7.2.1), so the change in a datum depends linearly on the change in model parameters
∆d i
a
=
Ύ
0
G i (r)∆m(r)dr.
(12)
0.014
0.012
0.010
0.008
0.006
0.004
0.002
0
Model QBS: error = 0.187
0.014
0.012
0.010
0.008
0.006
0.004
0.002
0
Model SL8: error = 0.183
0.014
0.012
0.010
0.008
0.006
0.004
0.002
0
Uniform scale: error = 0.155
0.014
0.012
0.010
0.008
0.006
0.004
0.002
0
Volume scale: error = 0.159
0
1000
2000
3000
Depth (km)
1000
2000
3000
Period (s)
1/q
µ
1/q
µ
1/q
µ
1/q
µ
Fig. 7.4-5 Comparison of various attenuation models. Despite the differences, all reproduce the general features of the data in Fig. 7.4-2, as shown in the
right hand panels. (Stein et al., 1981. Anelasticity in the Earth, 39–53, copyright by the American Geophysical Union.)
depths and are reluctant to force them into the solution. This
dilemma is an example of the general issue of deciding how
much we want the inversion solution to reflect our preconceptions, some of which may be correct, especially when derived
from other data, and some of which may be incorrect. We can
choose to focus on what the data require, what the data permit,
or a combination of the two.
These issues are illustrated in Fig. 7.4-5, which shows several
models for attenuation as a function of depth, all generally consistent with the data in Fig. 7.4-2. Model SL8 was derived by
parameter space inversion, whereas the others were derived
from data space inversion. The lower two models were derived
by inverting the data in Fig. 7.4-2 with different misfit functions, whereas the upper two were derived from different data.
Although the models differ, all have low attenuation in the
lower mantle, high attenuation in the upper mantle associated
with the low-velocity zone, and moderate attenuation in the
“lid” above the low-velocity zone. The models illustrate the
range of acceptable solutions. For example, the high attenu7.4 Stratified earth structure 437