

404 Seismograms as Signals
0
5
10
15
20
0
200
600
400
800
1000
0
200
600
400
800
1000
0
200
600
400
800
1000
Time (s)
Time (s)
Time (s)
Time (s)
Broadband record
Low-pass filtered record
High-pass filtered record
High-pass filtered record
(zoomed in)
P diff
PP
Local
event
(b)
(a)
(c)
(d)
once every ten seconds. The voltage is also fed back to the outer
capacitor plates to stabilize the system and increase linearity.
This force-feedback, an important feature of modern seismometers, provides a greater dynamic range because the mass
does not move as far to record large amplitudes. Because
this instrument can record a static displacement, it has a flat
response out to frequencies approaching ω = 0. Such longperiod response is valuable for studying normal modes and
large earthquakes.
The most versatile of the current digital seismometers are
broadband systems that record over a very broad frequency
range. At present, the primary broadband seismometers are the
Streckheisen STS-1 and STS-2 and Guralp-3T, which use forcefeedback technology to allow large dynamic and frequency
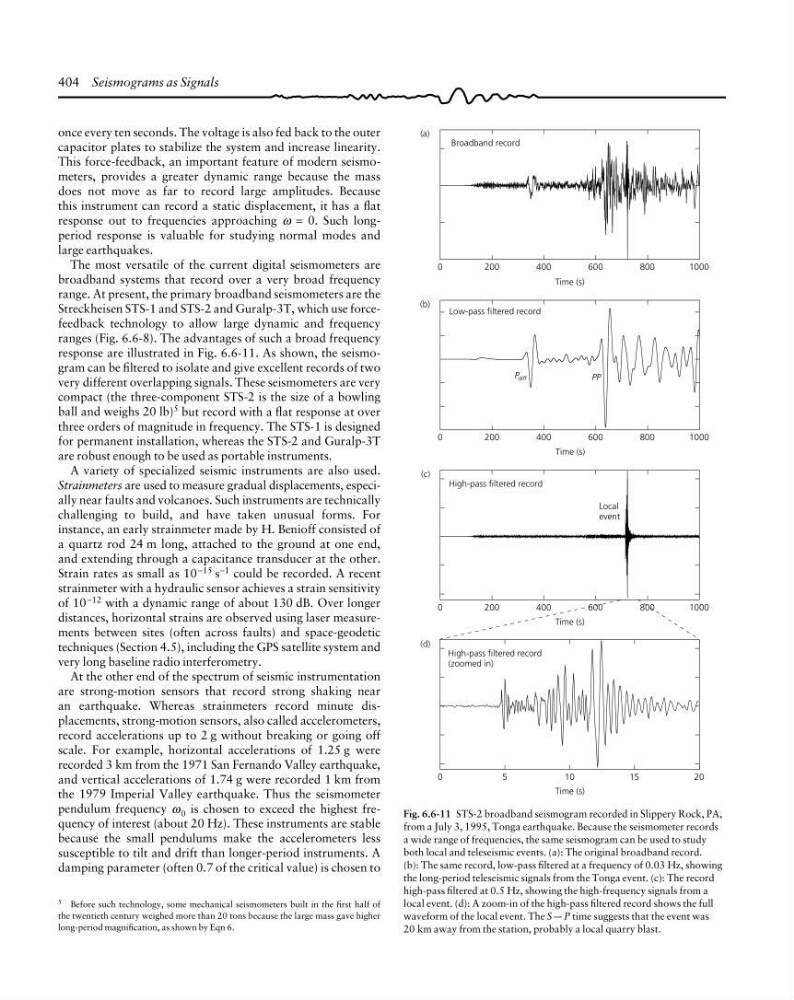
ranges (Fig. 6.6-8). The advantages of such a broad frequency
response are illustrated in Fig. 6.6-11. As shown, the seismogram can be filtered to isolate and give excellent records of two
very different overlapping signals. These seismometers are very
compact (the three-component STS-2 is the size of a bowling
ball and weighs 20 lb) 5 but record with a flat response at over
three orders of magnitude in frequency. The STS-1 is designed
for permanent installation, whereas the STS-2 and Guralp-3T
are robust enough to be used as portable instruments.
A variety of specialized seismic instruments are also used.
Strainmeters are used to measure gradual displacements, especially near faults and volcanoes. Such instruments are technically
challenging to build, and have taken unusual forms. For
instance, an early strainmeter made by H. Benioff consisted of
a quartz rod 24 m long, attached to the ground at one end,
and extending through a capacitance transducer at the other.
Strain rates as small as 10 −15 s
−1 could be recorded. A recent
strainmeter with a hydraulic sensor achieves a strain sensitivity
of 10 −12 with a dynamic range of about 130 dB. Over longer
distances, horizontal strains are observed using laser measurements between sites (often across faults) and space-geodetic
techniques (Section 4.5), including the GPS satellite system and
very long baseline radio interferometry.
At the other end of the spectrum of seismic instrumentation
are strong-motion sensors that record strong shaking near
an earthquake. Whereas strainmeters record minute displacements, strong-motion sensors, also called accelerometers,
record accelerations up to 2 g without breaking or going off
scale. For example, horizontal accelerations of 1.25 g were
recorded 3 km from the 1971 San Fernando Valley earthquake,
and vertical accelerations of 1.74 g were recorded 1 km from
the 1979 Imperial Valley earthquake. Thus the seismometer
pendulum frequency ω 0 is chosen to exceed the highest frequency of interest (about 20 Hz). These instruments are stable
because the small pendulums make the accelerometers less
susceptible to tilt and drift than longer-period instruments. A
damping parameter (often 0.7 of the critical value) is chosen to
5 Before such technology, some mechanical seismometers built in the first half of
the twentieth century weighed more than 20 tons because the large mass gave higher
long-period magnification, as shown by Eqn 6.
Fig. 6.6-11 STS-2 broadband seismogram recorded in Slippery Rock, PA,
from a July 3, 1995, Tonga earthquake. Because the seismometer records
a wide range of frequencies, the same seismogram can be used to study
both local and teleseismic events. (a): The original broadband record.
(b): The same record, low-pass filtered at a frequency of 0.03 Hz, showing
the long-period teleseismic signals from the Tonga event. (c): The record
high-pass filtered at 0.5 Hz, showing the high-frequency signals from a
local event. (d): A zoom-in of the high-pass filtered record shows the full
waveform of the local event. The S a P time suggests that the event was
20 km away from the station, probably a local quarry blast.
0
5
10
15
20
0
200
600
400
800
1000
0
200
600
400
800
1000
0
200
600
400
800
1000
Time (s)
Time (s)
Time (s)
Time (s)
Broadband record
Low-pass filtered record
High-pass filtered record
High-pass filtered record
(zoomed in)
P diff
PP
Local
event
(b)
(a)
(c)
(d)
once every ten seconds. The voltage is also fed back to the outer
capacitor plates to stabilize the system and increase linearity.
This force-feedback, an important feature of modern seismometers, provides a greater dynamic range because the mass
does not move as far to record large amplitudes. Because
this instrument can record a static displacement, it has a flat
response out to frequencies approaching ω = 0. Such longperiod response is valuable for studying normal modes and
large earthquakes.
The most versatile of the current digital seismometers are
broadband systems that record over a very broad frequency
range. At present, the primary broadband seismometers are the
Streckheisen STS-1 and STS-2 and Guralp-3T, which use forcefeedback technology to allow large dynamic and frequency
ranges (Fig. 6.6-8). The advantages of such a broad frequency
response are illustrated in Fig. 6.6-11. As shown, the seismogram can be filtered to isolate and give excellent records of two
very different overlapping signals. These seismometers are very
compact (the three-component STS-2 is the size of a bowling
ball and weighs 20 lb) 5 but record with a flat response at over
three orders of magnitude in frequency. The STS-1 is designed
for permanent installation, whereas the STS-2 and Guralp-3T
are robust enough to be used as portable instruments.
A variety of specialized seismic instruments are also used.
Strainmeters are used to measure gradual displacements, especially near faults and volcanoes. Such instruments are technically
challenging to build, and have taken unusual forms. For
instance, an early strainmeter made by H. Benioff consisted of
a quartz rod 24 m long, attached to the ground at one end,
and extending through a capacitance transducer at the other.
Strain rates as small as 10 −15 s
−1 could be recorded. A recent
strainmeter with a hydraulic sensor achieves a strain sensitivity
of 10 −12 with a dynamic range of about 130 dB. Over longer
distances, horizontal strains are observed using laser measurements between sites (often across faults) and space-geodetic
techniques (Section 4.5), including the GPS satellite system and
very long baseline radio interferometry.
At the other end of the spectrum of seismic instrumentation
are strong-motion sensors that record strong shaking near
an earthquake. Whereas strainmeters record minute displacements, strong-motion sensors, also called accelerometers,
record accelerations up to 2 g without breaking or going off
scale. For example, horizontal accelerations of 1.25 g were
recorded 3 km from the 1971 San Fernando Valley earthquake,
and vertical accelerations of 1.74 g were recorded 1 km from
the 1979 Imperial Valley earthquake. Thus the seismometer
pendulum frequency ω 0 is chosen to exceed the highest frequency of interest (about 20 Hz). These instruments are stable
because the small pendulums make the accelerometers less
susceptible to tilt and drift than longer-period instruments. A
damping parameter (often 0.7 of the critical value) is chosen to
5 Before such technology, some mechanical seismometers built in the first half of
the twentieth century weighed more than 20 tons because the large mass gave higher
long-period magnification, as shown by Eqn 6.
Fig. 6.6-11 STS-2 broadband seismogram recorded in Slippery Rock, PA,
from a July 3, 1995, Tonga earthquake. Because the seismometer records
a wide range of frequencies, the same seismogram can be used to study
both local and teleseismic events. (a): The original broadband record.
(b): The same record, low-pass filtered at a frequency of 0.03 Hz, showing
the long-period teleseismic signals from the Tonga event. (c): The record
high-pass filtered at 0.5 Hz, showing the high-frequency signals from a
local event. (d): A zoom-in of the high-pass filtered record shows the full
waveform of the local event. The S a P time suggests that the event was
20 km away from the station, probably a local quarry blast.