

400 Seismograms as Signals
0
500
1000
1500
2000
2500
0
100
200
300
400
500
Time (s)
Time (s)
0.0001
0.001
0.01
0.1
1
10
Frequency (Hz)
Logarithmic amplitude
Amplitude
Amplitude
Pre-signal
noise
Full seismic record
Pre-signal noise window
Noise window amplitude spectrum
6.6.3 Earth noise
An important consideration in designing seismometers is earth
noise. A challenge of seismometry is to create sensors sensitive
enough to record small teleseismic signals, given that noise sets
a limit to the level of detection. Moreover, studies using seismic
data in many applications must consider the signal-to-noise
ratio.
Many factors contribute to seismic noise, including solar and
lunar tides within the solid earth, fluctuations in temperature
and atmospheric pressure, storms, human activities, and ocean
waves. These factors are constantly at work, so the crust is
continually reverberating. Most of the noise occurs at periods
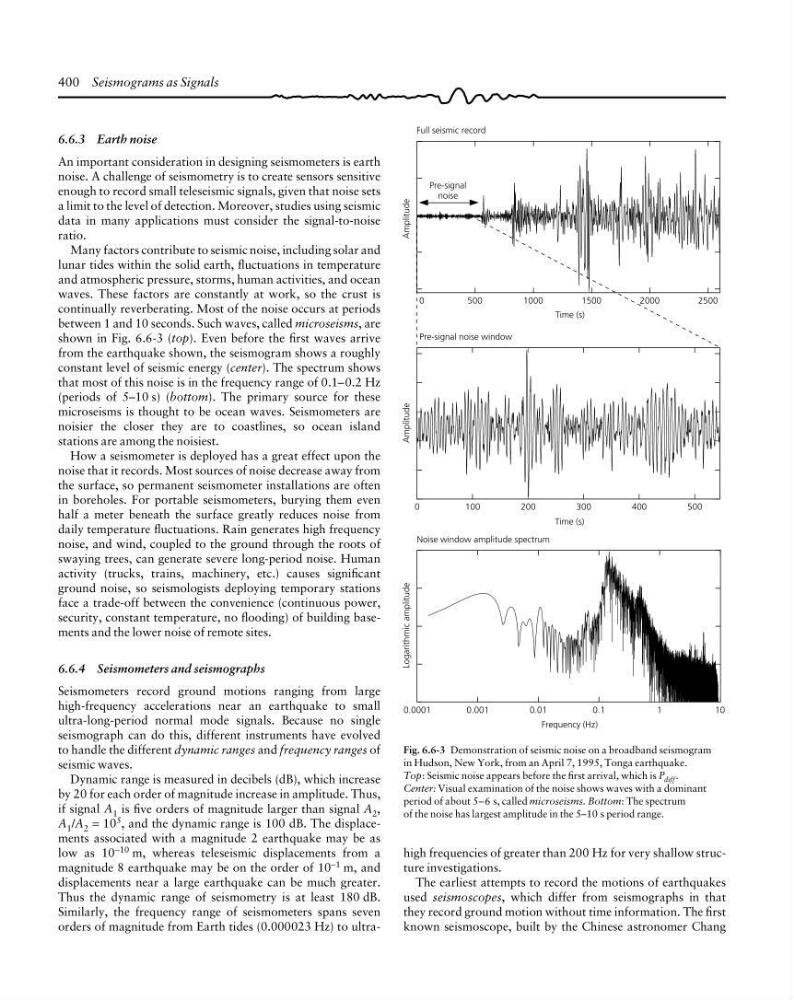
between 1 and 10 seconds. Such waves, called microseisms, are
shown in Fig. 6.6-3 (top). Even before the first waves arrive
from the earthquake shown, the seismogram shows a roughly
constant level of seismic energy (center). The spectrum shows
that most of this noise is in the frequency range of 0.1–0.2 Hz
(periods of 5–10 s) (bottom). The primary source for these
microseisms is thought to be ocean waves. Seismometers are
noisier the closer they are to coastlines, so ocean island
stations are among the noisiest.
How a seismometer is deployed has a great effect upon the
noise that it records. Most sources of noise decrease away from
the surface, so permanent seismometer installations are often
in boreholes. For portable seismometers, burying them even
half a meter beneath the surface greatly reduces noise from
daily temperature fluctuations. Rain generates high frequency
noise, and wind, coupled to the ground through the roots of
swaying trees, can generate severe long-period noise. Human
activity (trucks, trains, machinery, etc.) causes significant
ground noise, so seismologists deploying temporary stations
face a trade-off between the convenience (continuous power,
security, constant temperature, no flooding) of building basements and the lower noise of remote sites.
6.6.4 Seismometers and seismographs
Seismometers record ground motions ranging from large
high-frequency accelerations near an earthquake to small
ultra-long-period normal mode signals. Because no single
seismograph can do this, different instruments have evolved
to handle the different dynamic ranges and frequency ranges of
seismic waves.
Dynamic range is measured in decibels (dB), which increase
by 20 for each order of magnitude increase in amplitude. Thus,
if signal A 1 is five orders of magnitude larger than signal A 2 ,
A 1 /A 2 = 10 5 , and the dynamic range is 100 dB. The displacements associated with a magnitude 2 earthquake may be as
low as 10
−10 m, whereas teleseismic displacements from a
magnitude 8 earthquake may be on the order of 10 −1 m, and
displacements near a large earthquake can be much greater.
Thus the dynamic range of seismometry is at least 180 dB.
Similarly, the frequency range of seismometers spans seven
orders of magnitude from Earth tides (0.000023 Hz) to ultrahigh frequencies of greater than 200 Hz for very shallow structure investigations.
The earliest attempts to record the motions of earthquakes
used seismoscopes, which differ from seismographs in that
they record ground motion without time information. The first
known seismoscope, built by the Chinese astronomer Chang
Fig. 6.6-3 Demonstration of seismic noise on a broadband seismogram
in Hudson, New York, from an April 7, 1995, Tonga earthquake.
Top: Seismic noise appears before the first arrival, which is P diff .
Center: Visual examination of the noise shows waves with a dominant
period of about 5–6 s, called microseisms. Bottom: The spectrum
of the noise has largest amplitude in the 5–10 s period range.
0
500
1000
1500
2000
2500
0
100
200
300
400
500
Time (s)
Time (s)
0.0001
0.001
0.01
0.1
1
10
Frequency (Hz)
Logarithmic amplitude
Amplitude
Amplitude
Pre-signal
noise
Full seismic record
Pre-signal noise window
Noise window amplitude spectrum
6.6.3 Earth noise
An important consideration in designing seismometers is earth
noise. A challenge of seismometry is to create sensors sensitive
enough to record small teleseismic signals, given that noise sets
a limit to the level of detection. Moreover, studies using seismic
data in many applications must consider the signal-to-noise
ratio.
Many factors contribute to seismic noise, including solar and
lunar tides within the solid earth, fluctuations in temperature
and atmospheric pressure, storms, human activities, and ocean
waves. These factors are constantly at work, so the crust is
continually reverberating. Most of the noise occurs at periods
between 1 and 10 seconds. Such waves, called microseisms, are
shown in Fig. 6.6-3 (top). Even before the first waves arrive
from the earthquake shown, the seismogram shows a roughly
constant level of seismic energy (center). The spectrum shows
that most of this noise is in the frequency range of 0.1–0.2 Hz
(periods of 5–10 s) (bottom). The primary source for these
microseisms is thought to be ocean waves. Seismometers are
noisier the closer they are to coastlines, so ocean island
stations are among the noisiest.
How a seismometer is deployed has a great effect upon the
noise that it records. Most sources of noise decrease away from
the surface, so permanent seismometer installations are often
in boreholes. For portable seismometers, burying them even
half a meter beneath the surface greatly reduces noise from
daily temperature fluctuations. Rain generates high frequency
noise, and wind, coupled to the ground through the roots of
swaying trees, can generate severe long-period noise. Human
activity (trucks, trains, machinery, etc.) causes significant
ground noise, so seismologists deploying temporary stations
face a trade-off between the convenience (continuous power,
security, constant temperature, no flooding) of building basements and the lower noise of remote sites.
6.6.4 Seismometers and seismographs
Seismometers record ground motions ranging from large
high-frequency accelerations near an earthquake to small
ultra-long-period normal mode signals. Because no single
seismograph can do this, different instruments have evolved
to handle the different dynamic ranges and frequency ranges of
seismic waves.
Dynamic range is measured in decibels (dB), which increase
by 20 for each order of magnitude increase in amplitude. Thus,
if signal A 1 is five orders of magnitude larger than signal A 2 ,
A 1 /A 2 = 10 5 , and the dynamic range is 100 dB. The displacements associated with a magnitude 2 earthquake may be as
low as 10
−10 m, whereas teleseismic displacements from a
magnitude 8 earthquake may be on the order of 10 −1 m, and
displacements near a large earthquake can be much greater.
Thus the dynamic range of seismometry is at least 180 dB.
Similarly, the frequency range of seismometers spans seven
orders of magnitude from Earth tides (0.000023 Hz) to ultrahigh frequencies of greater than 200 Hz for very shallow structure investigations.
The earliest attempts to record the motions of earthquakes
used seismoscopes, which differ from seismographs in that
they record ground motion without time information. The first
known seismoscope, built by the Chinese astronomer Chang
Fig. 6.6-3 Demonstration of seismic noise on a broadband seismogram
in Hudson, New York, from an April 7, 1995, Tonga earthquake.
Top: Seismic noise appears before the first arrival, which is P diff .
Center: Visual examination of the noise shows waves with a dominant
period of about 5–6 s, called microseisms. Bottom: The spectrum
of the noise has largest amplitude in the 5–10 s period range.