

Time (min.)
60
50
40
30
20
10
0
0
30
60
90
120
150
180
Distance (°)
Vertical
Time (min.)
60
50
40
30
20
10
0
0
30
60
90
120
150
180
Distance (°)
Radial
Time (min.)
60
50
40
30
20
10
0
0
30
60
90
120
150
180
Distance (°)
Transverse
Time (min.)
60
50
40
30
20
10
0
0
30
60
90
120
150
180
Distance (°)
IASP91 travel times
PP PP P
SK SP PP
SK SP P
PK PP KS
PP PP
ScS3
ScS2
PKPPK P
PKKP
Pc S
P
ScS
S
P S
S S S
P P S
P P P S
PP
Pdiff
P P P
P P P P
S S
P P P P S
SK SP
SK K S
Sd iff
SK S
PK S
PK P
PP
P P S
PK PP cP
P P P S
R 1
S 5
S 6 S 7
S S S S P
S S S
S 4
PPP
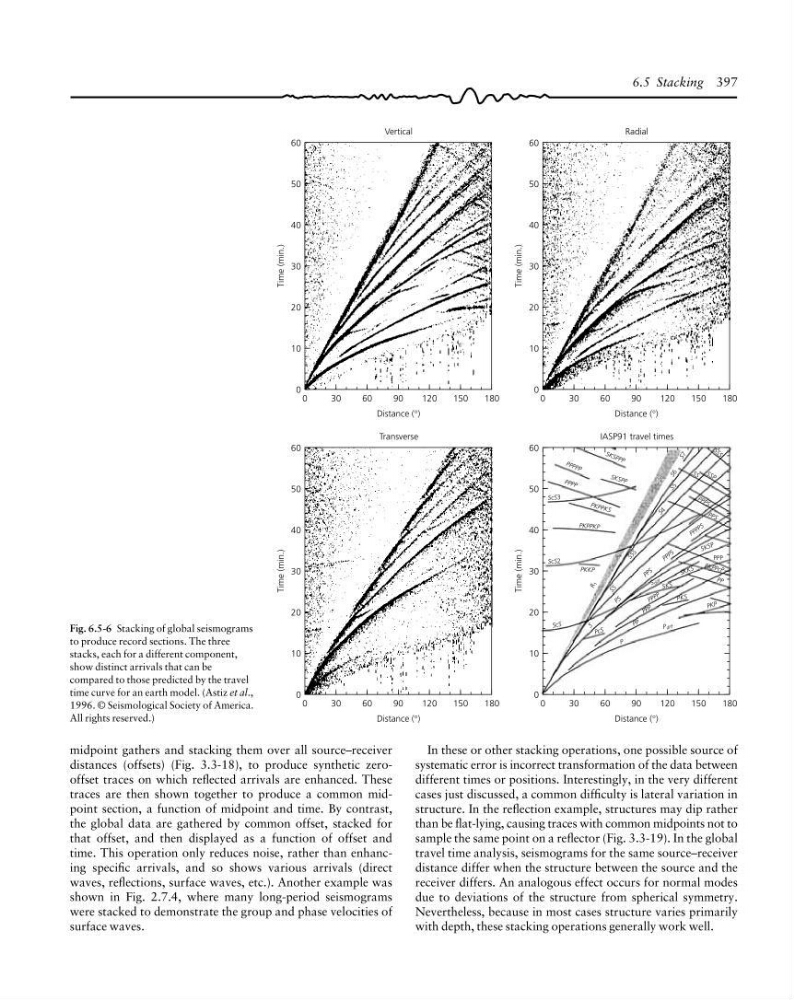
Fig. 6.5-6 Stacking of global seismograms
to produce record sections. The three
stacks, each for a different component,
show distinct arrivals that can be
compared to those predicted by the travel
time curve for an earth model. (Astiz et al.,
1996. © Seismological Society of America.
All rights reserved.)
In these or other stacking operations, one possible source of
systematic error is incorrect transformation of the data between
different times or positions. Interestingly, in the very different
cases just discussed, a common difficulty is lateral variation in
structure. In the reflection example, structures may dip rather
than be flat-lying, causing traces with common midpoints not to
sample the same point on a reflector (Fig. 3.3-19). In the global
travel time analysis, seismograms for the same source–receiver
distance differ when the structure between the source and the
receiver differs. An analogous effect occurs for normal modes
due to deviations of the structure from spherical symmetry.
Nevertheless, because in most cases structure varies primarily
with depth, these stacking operations generally work well.
midpoint gathers and stacking them over all source–receiver
distances (offsets) (Fig. 3.3-18), to produce synthetic zerooffset traces on which reflected arrivals are enhanced. These
traces are then shown together to produce a common midpoint section, a function of midpoint and time. By contrast,
the global data are gathered by common offset, stacked for
that offset, and then displayed as a function of offset and
time. This operation only reduces noise, rather than enhancing specific arrivals, and so shows various arrivals (direct
waves, reflections, surface waves, etc.). Another example was
shown in Fig. 2.7.4, where many long-period seismograms
were stacked to demonstrate the group and phase velocities of
surface waves.
6.5 Stacking 397
60
50
40
30
20
10
0
0
30
60
90
120
150
180
Distance (°)
Vertical
Time (min.)
60
50
40
30
20
10
0
0
30
60
90
120
150
180
Distance (°)
Radial
Time (min.)
60
50
40
30
20
10
0
0
30
60
90
120
150
180
Distance (°)
Transverse
Time (min.)
60
50
40
30
20
10
0
0
30
60
90
120
150
180
Distance (°)
IASP91 travel times
PP PP P
SK SP PP
SK SP P
PK PP KS
PP PP
ScS3
ScS2
PKPPK P
PKKP
Pc S
P
ScS
S
P S
S S S
P P S
P P P S
PP
Pdiff
P P P
P P P P
S S
P P P P S
SK SP
SK K S
Sd iff
SK S
PK S
PK P
PP
P P S
PK PP cP
P P P S
R 1
S 5
S 6 S 7
S S S S P
S S S
S 4
PPP
Fig. 6.5-6 Stacking of global seismograms
to produce record sections. The three
stacks, each for a different component,
show distinct arrivals that can be
compared to those predicted by the travel
time curve for an earth model. (Astiz et al.,
1996. © Seismological Society of America.
All rights reserved.)
In these or other stacking operations, one possible source of
systematic error is incorrect transformation of the data between
different times or positions. Interestingly, in the very different
cases just discussed, a common difficulty is lateral variation in
structure. In the reflection example, structures may dip rather
than be flat-lying, causing traces with common midpoints not to
sample the same point on a reflector (Fig. 3.3-19). In the global
travel time analysis, seismograms for the same source–receiver
distance differ when the structure between the source and the
receiver differs. An analogous effect occurs for normal modes
due to deviations of the structure from spherical symmetry.
Nevertheless, because in most cases structure varies primarily
with depth, these stacking operations generally work well.
midpoint gathers and stacking them over all source–receiver
distances (offsets) (Fig. 3.3-18), to produce synthetic zerooffset traces on which reflected arrivals are enhanced. These
traces are then shown together to produce a common midpoint section, a function of midpoint and time. By contrast,
the global data are gathered by common offset, stacked for
that offset, and then displayed as a function of offset and
time. This operation only reduces noise, rather than enhancing specific arrivals, and so shows various arrivals (direct
waves, reflections, surface waves, etc.). Another example was
shown in Fig. 2.7.4, where many long-period seismograms
were stacked to demonstrate the group and phase velocities of
surface waves.
6.5 Stacking 397