

386 Seismograms as Signals
Spectrum of unsampled
data (band limited) with
signal at | | < /∆t
ω π
− /∆t
2 /∆t
− /∆t
−2 /∆t
π
Aliasing in the frequency domain
(a)
0
/ ∆t
π
π
(b)
Spectrum of sampled
data: periodic but no
aliasing
0
/ ∆t
π
(c)
Spectrum of sampled
data with signal at
| | > /∆t
ω π
0
2 /∆t
π
−2 /∆t
π
π
π
Aliased
spectrum
Actual spectrum
Overlap where
aliasing occurs
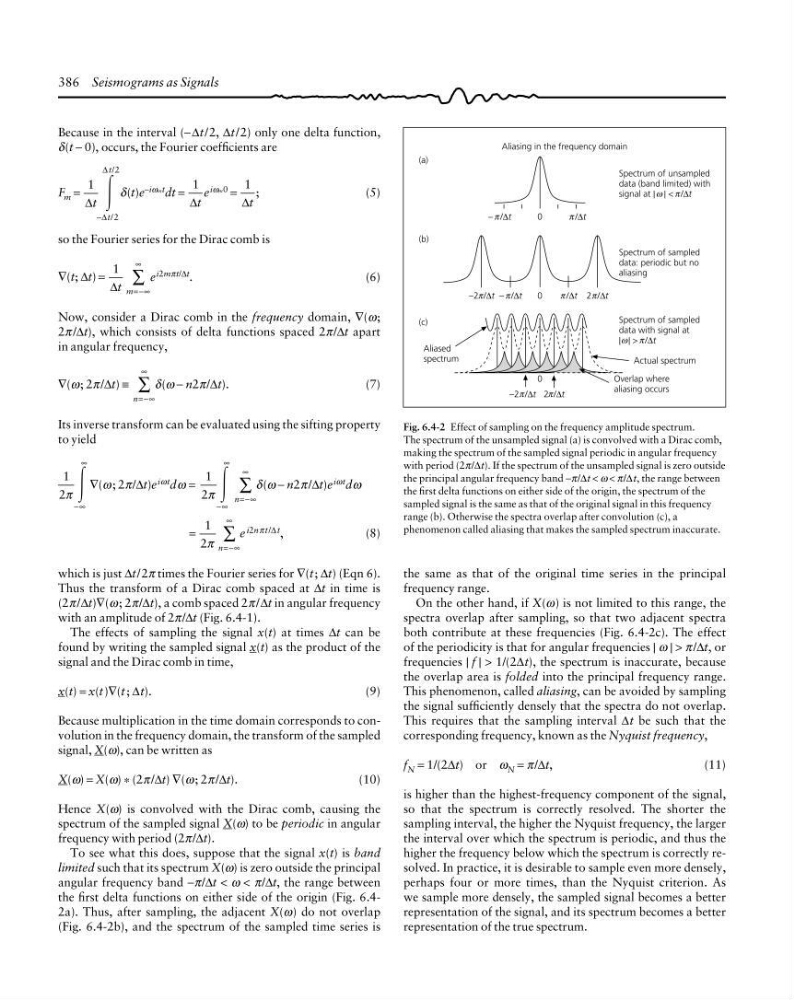
Fig. 6.4-2 Effect of sampling on the frequency amplitude spectrum.
The spectrum of the unsampled signal (a) is convolved with a Dirac comb,
making the spectrum of the sampled signal periodic in angular frequency
with period (2π/∆t). If the spectrum of the unsampled signal is zero outside
the principal angular frequency band −π/∆t < ω < π/∆t, the range between
the first delta functions on either side of the origin, the spectrum of the
sampled signal is the same as that of the original signal in this frequency
range (b). Otherwise the spectra overlap after convolution (c), a
phenomenon called aliasing that makes the sampled spectrum inaccurate.
Because in the interval (−∆t/2, ∆t/2) only one delta function,
δ(t − 0), occurs, the Fourier coefficients are
F m =
1
2
2
∆
∆
∆
t
t
t
Ύ
− /
/
δ(t)e −iωmt dt =
1
∆t
e iωm0 =
1
∆t
;
(5)
so the Fourier series for the Dirac comb is
∇(t; ∆t) =
1
∆t m=−∞
∞
∑ e i2mπt/∆t .
(6)
Now, consider a Dirac comb in the frequency domain, ∇(ω;
2π /∆t), which consists of delta functions spaced 2π/∆t apart
in angular frequency,
∇(ω; 2π /∆t) ≡
n=−∞
∞
∑ δ(ω − n2π/∆t).
(7)
Its inverse transform can be evaluated using the sifting property
to yield
1
2π Ύ
−∞
∞
∇(ω ; 2π/∆t)e iωt dω =
1
2π Ύ
−∞
∞
n=−∞
∞
∑ δ(ω − n2π /∆t)e iωt dω
=
1
2π n=−∞
∞
∑ e i2nπ t/∆ t ,
(8)
which is just ∆t/2π times the Fourier series for ∇(t; ∆t) (Eqn 6).
Thus the transform of a Dirac comb spaced at ∆t in time is
(2π /∆t)∇(ω ; 2π/∆t), a comb spaced 2π /∆t in angular frequency
with an amplitude of 2π/∆t (Fig. 6.4-1).
The effects of sampling the signal x(t) at times ∆t can be
found by writing the sampled signal x(t) as the product of the
signal and the Dirac comb in time,
x(t) = x(t)∇(t ; ∆t).
(9)
Because multiplication in the time domain corresponds to convolution in the frequency domain, the transform of the sampled
signal, X(ω), can be written as
X(ω) = X(ω) * (2π /∆t) ∇(ω ; 2π /∆t).
(10)
Hence X(ω) is convolved with the Dirac comb, causing the
spectrum of the sampled signal X(ω) to be periodic in angular
frequency with period (2π/∆t).
To see what this does, suppose that the signal x(t) is band
limited such that its spectrum X(ω) is zero outside the principal
angular frequency band −π/∆t < ω < π/∆t, the range between
the first delta functions on either side of the origin (Fig. 6.42a). Thus, after sampling, the adjacent X(ω) do not overlap
(Fig. 6.4-2b), and the spectrum of the sampled time series is
the same as that of the original time series in the principal
frequency range.
On the other hand, if X(ω) is not limited to this range, the
spectra overlap after sampling, so that two adjacent spectra
both contribute at these frequencies (Fig. 6.4-2c). The effect
of the periodicity is that for angular frequencies | ω | > π /∆t, or
frequencies | f | > 1/(2∆t), the spectrum is inaccurate, because
the overlap area is folded into the principal frequency range.
This phenomenon, called aliasing, can be avoided by sampling
the signal sufficiently densely that the spectra do not overlap.
This requires that the sampling interval ∆t be such that the
corresponding frequency, known as the Nyquist frequency,
f N = 1/(2∆t) or ω N = π/∆t,
(11)
is higher than the highest-frequency component of the signal,
so that the spectrum is correctly resolved. The shorter the
sampling interval, the higher the Nyquist frequency, the larger
the interval over which the spectrum is periodic, and thus the
higher the frequency below which the spectrum is correctly resolved. In practice, it is desirable to sample even more densely,
perhaps four or more times, than the Nyquist criterion. As
we sample more densely, the sampled signal becomes a better
representation of the signal, and its spectrum becomes a better
representation of the true spectrum.
Spectrum of unsampled
data (band limited) with
signal at | | < /∆t
ω π
− /∆t
2 /∆t
− /∆t
−2 /∆t
π
Aliasing in the frequency domain
(a)
0
/ ∆t
π
π
(b)
Spectrum of sampled
data: periodic but no
aliasing
0
/ ∆t
π
(c)
Spectrum of sampled
data with signal at
| | > /∆t
ω π
0
2 /∆t
π
−2 /∆t
π
π
π
Aliased
spectrum
Actual spectrum
Overlap where
aliasing occurs
Fig. 6.4-2 Effect of sampling on the frequency amplitude spectrum.
The spectrum of the unsampled signal (a) is convolved with a Dirac comb,
making the spectrum of the sampled signal periodic in angular frequency
with period (2π/∆t). If the spectrum of the unsampled signal is zero outside
the principal angular frequency band −π/∆t < ω < π/∆t, the range between
the first delta functions on either side of the origin, the spectrum of the
sampled signal is the same as that of the original signal in this frequency
range (b). Otherwise the spectra overlap after convolution (c), a
phenomenon called aliasing that makes the sampled spectrum inaccurate.
Because in the interval (−∆t/2, ∆t/2) only one delta function,
δ(t − 0), occurs, the Fourier coefficients are
F m =
1
2
2
∆
∆
∆
t
t
t
Ύ
− /
/
δ(t)e −iωmt dt =
1
∆t
e iωm0 =
1
∆t
;
(5)
so the Fourier series for the Dirac comb is
∇(t; ∆t) =
1
∆t m=−∞
∞
∑ e i2mπt/∆t .
(6)
Now, consider a Dirac comb in the frequency domain, ∇(ω;
2π /∆t), which consists of delta functions spaced 2π/∆t apart
in angular frequency,
∇(ω; 2π /∆t) ≡
n=−∞
∞
∑ δ(ω − n2π/∆t).
(7)
Its inverse transform can be evaluated using the sifting property
to yield
1
2π Ύ
−∞
∞
∇(ω ; 2π/∆t)e iωt dω =
1
2π Ύ
−∞
∞
n=−∞
∞
∑ δ(ω − n2π /∆t)e iωt dω
=
1
2π n=−∞
∞
∑ e i2nπ t/∆ t ,
(8)
which is just ∆t/2π times the Fourier series for ∇(t; ∆t) (Eqn 6).
Thus the transform of a Dirac comb spaced at ∆t in time is
(2π /∆t)∇(ω ; 2π/∆t), a comb spaced 2π /∆t in angular frequency
with an amplitude of 2π/∆t (Fig. 6.4-1).
The effects of sampling the signal x(t) at times ∆t can be
found by writing the sampled signal x(t) as the product of the
signal and the Dirac comb in time,
x(t) = x(t)∇(t ; ∆t).
(9)
Because multiplication in the time domain corresponds to convolution in the frequency domain, the transform of the sampled
signal, X(ω), can be written as
X(ω) = X(ω) * (2π /∆t) ∇(ω ; 2π /∆t).
(10)
Hence X(ω) is convolved with the Dirac comb, causing the
spectrum of the sampled signal X(ω) to be periodic in angular
frequency with period (2π/∆t).
To see what this does, suppose that the signal x(t) is band
limited such that its spectrum X(ω) is zero outside the principal
angular frequency band −π/∆t < ω < π/∆t, the range between
the first delta functions on either side of the origin (Fig. 6.42a). Thus, after sampling, the adjacent X(ω) do not overlap
(Fig. 6.4-2b), and the spectrum of the sampled time series is
the same as that of the original time series in the principal
frequency range.
On the other hand, if X(ω) is not limited to this range, the
spectra overlap after sampling, so that two adjacent spectra
both contribute at these frequencies (Fig. 6.4-2c). The effect
of the periodicity is that for angular frequencies | ω | > π /∆t, or
frequencies | f | > 1/(2∆t), the spectrum is inaccurate, because
the overlap area is folded into the principal frequency range.
This phenomenon, called aliasing, can be avoided by sampling
the signal sufficiently densely that the spectra do not overlap.
This requires that the sampling interval ∆t be such that the
corresponding frequency, known as the Nyquist frequency,
f N = 1/(2∆t) or ω N = π/∆t,
(11)
is higher than the highest-frequency component of the signal,
so that the spectrum is correctly resolved. The shorter the
sampling interval, the higher the Nyquist frequency, the larger
the interval over which the spectrum is periodic, and thus the
higher the frequency below which the spectrum is correctly resolved. In practice, it is desirable to sample even more densely,
perhaps four or more times, than the Nyquist criterion. As
we sample more densely, the sampled signal becomes a better
representation of the signal, and its spectrum becomes a better
representation of the true spectrum.