

0.00
0.00
0.00
Normalized amplitude
1.0
0.5
0.0
Total signal
Body waves
Surface waves
Vanuatu earthquake (M s 6.5) time series
S
P
Rayleigh
0
200
400
600
Time (s)
Amplitude spectrum
800
1000
1200
0.00
0.02
0.04
0.06
Frequency (Hz)
Surface waves
Body waves
0.08
0.10
0.12
0.14
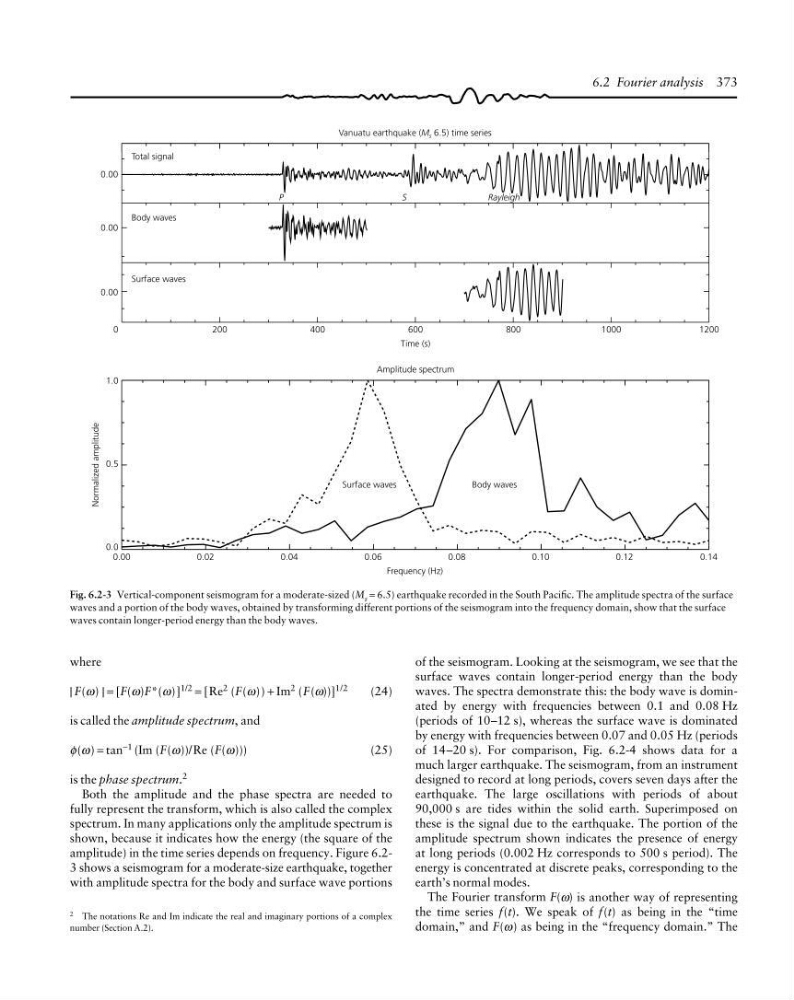
Fig. 6.2-3 Vertical-component seismogram for a moderate-sized (M s = 6.5) earthquake recorded in the South Pacific. The amplitude spectra of the surface
waves and a portion of the body waves, obtained by transforming different portions of the seismogram into the frequency domain, show that the surface
waves contain longer-period energy than the body waves.
2 The notations Re and Im indicate the real and imaginary portions of a complex
number (Section A.2).
where
| F(ω) | = [F(ω)F*(ω)] 1/2 = [Re 2 (F(ω)) + Im 2 (F(ω))] 1/2
(24)
is called the amplitude spectrum, and
φ(ω) = tan −1 (Im (F(ω))/Re (F(ω)))
(25)
is the phase spectrum. 2
Both the amplitude and the phase spectra are needed to
fully represent the transform, which is also called the complex
spectrum. In many applications only the amplitude spectrum is
shown, because it indicates how the energy (the square of the
amplitude) in the time series depends on frequency. Figure 6.23 shows a seismogram for a moderate-size earthquake, together
with amplitude spectra for the body and surface wave portions
of the seismogram. Looking at the seismogram, we see that the
surface waves contain longer-period energy than the body
waves. The spectra demonstrate this: the body wave is dominated by energy with frequencies between 0.1 and 0.08 Hz
(periods of 10–12 s), whereas the surface wave is dominated
by energy with frequencies between 0.07 and 0.05 Hz (periods
of 14–20 s). For comparison, Fig. 6.2-4 shows data for a
much larger earthquake. The seismogram, from an instrument
designed to record at long periods, covers seven days after the
earthquake. The large oscillations with periods of about
90,000 s are tides within the solid earth. Superimposed on
these is the signal due to the earthquake. The portion of the
amplitude spectrum shown indicates the presence of energy
at long periods (0.002 Hz corresponds to 500 s period). The
energy is concentrated at discrete peaks, corresponding to the
earth’s normal modes.
The Fourier transform F(ω) is another way of representing
the time series f(t). We speak of f(t) as being in the “time
domain,” and F(ω) as being in the “frequency domain.” The
6.2 Fourier analysis 373
0.00
0.00
Normalized amplitude
1.0
0.5
0.0
Total signal
Body waves
Surface waves
Vanuatu earthquake (M s 6.5) time series
S
P
Rayleigh
0
200
400
600
Time (s)
Amplitude spectrum
800
1000
1200
0.00
0.02
0.04
0.06
Frequency (Hz)
Surface waves
Body waves
0.08
0.10
0.12
0.14
Fig. 6.2-3 Vertical-component seismogram for a moderate-sized (M s = 6.5) earthquake recorded in the South Pacific. The amplitude spectra of the surface
waves and a portion of the body waves, obtained by transforming different portions of the seismogram into the frequency domain, show that the surface
waves contain longer-period energy than the body waves.
2 The notations Re and Im indicate the real and imaginary portions of a complex
number (Section A.2).
where
| F(ω) | = [F(ω)F*(ω)] 1/2 = [Re 2 (F(ω)) + Im 2 (F(ω))] 1/2
(24)
is called the amplitude spectrum, and
φ(ω) = tan −1 (Im (F(ω))/Re (F(ω)))
(25)
is the phase spectrum. 2
Both the amplitude and the phase spectra are needed to
fully represent the transform, which is also called the complex
spectrum. In many applications only the amplitude spectrum is
shown, because it indicates how the energy (the square of the
amplitude) in the time series depends on frequency. Figure 6.23 shows a seismogram for a moderate-size earthquake, together
with amplitude spectra for the body and surface wave portions
of the seismogram. Looking at the seismogram, we see that the
surface waves contain longer-period energy than the body
waves. The spectra demonstrate this: the body wave is dominated by energy with frequencies between 0.1 and 0.08 Hz
(periods of 10–12 s), whereas the surface wave is dominated
by energy with frequencies between 0.07 and 0.05 Hz (periods
of 14–20 s). For comparison, Fig. 6.2-4 shows data for a
much larger earthquake. The seismogram, from an instrument
designed to record at long periods, covers seven days after the
earthquake. The large oscillations with periods of about
90,000 s are tides within the solid earth. Superimposed on
these is the signal due to the earthquake. The portion of the
amplitude spectrum shown indicates the presence of energy
at long periods (0.002 Hz corresponds to 500 s period). The
energy is concentrated at discrete peaks, corresponding to the
earth’s normal modes.
The Fourier transform F(ω) is another way of representing
the time series f(t). We speak of f(t) as being in the “time
domain,” and F(ω) as being in the “frequency domain.” The
6.2 Fourier analysis 373