

from topography and plate boundary forces. The ratio of stress
to strain rate at any point, which is the vertically averaged
effective viscosity, varies significantly. Low values along the
San Andreas fault and western Great Basin show that the strain
rates are relatively high for the predicted stress, consistent with
a weak lower crust. The Great Valley–Sierra Nevada block has
little internal deformation, and thus acts relatively rigidly and
appears as a high-viscosity region. Summing seismic moment
tensors (Section 5.6.2) yields a seismic strain rate averaging
about 60% of the inferred total strain. As discussed earlier, this
discrepancy may indicate some aseismic deformation or that
the 150 years of historical seismicity is too short for a reliable
estimate.
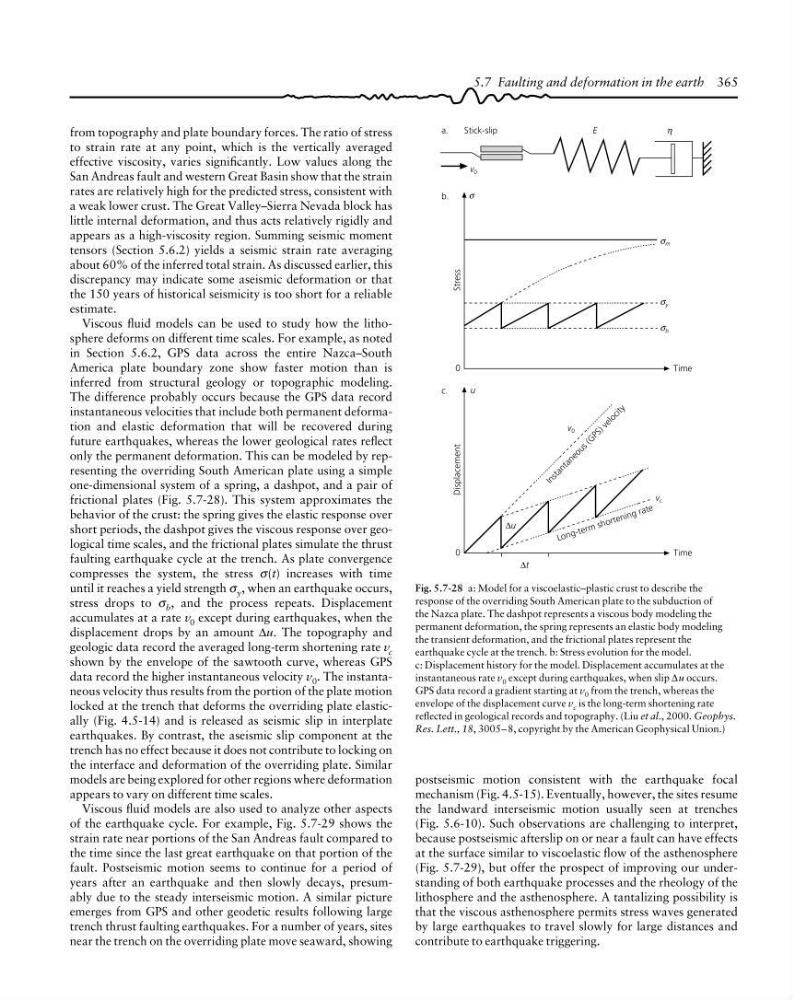
Viscous fluid models can be used to study how the lithosphere deforms on different time scales. For example, as noted
in Section 5.6.2, GPS data across the entire Nazca–South
America plate boundary zone show faster motion than is
inferred from structural geology or topographic modeling.
The difference probably occurs because the GPS data record
instantaneous velocities that include both permanent deformation and elastic deformation that will be recovered during
future earthquakes, whereas the lower geological rates reflect
only the permanent deformation. This can be modeled by representing the overriding South American plate using a simple
one-dimensional system of a spring, a dashpot, and a pair of
frictional plates (Fig. 5.7-28). This system approximates the
behavior of the crust: the spring gives the elastic response over
short periods, the dashpot gives the viscous response over geological time scales, and the frictional plates simulate the thrust
faulting earthquake cycle at the trench. As plate convergence
compresses the system, the stress σ(t) increases with time
until it reaches a yield strength σ y , when an earthquake occurs,
stress drops to σ b , and the process repeats. Displacement
accumulates at a rate v 0 except during earthquakes, when the
displacement drops by an amount ∆u. The topography and
geologic data record the averaged long-term shortening rate v c
shown by the envelope of the sawtooth curve, whereas GPS
data record the higher instantaneous velocity v 0 . The instantaneous velocity thus results from the portion of the plate motion
locked at the trench that deforms the overriding plate elastically (Fig. 4.5-14) and is released as seismic slip in interplate
earthquakes. By contrast, the aseismic slip component at the
trench has no effect because it does not contribute to locking on
the interface and deformation of the overriding plate. Similar
models are being explored for other regions where deformation
appears to vary on different time scales.
Viscous fluid models are also used to analyze other aspects
of the earthquake cycle. For example, Fig. 5.7-29 shows the
strain rate near portions of the San Andreas fault compared to
the time since the last great earthquake on that portion of the
fault. Postseismic motion seems to continue for a period of
years after an earthquake and then slowly decays, presumably due to the steady interseismic motion. A similar picture
emerges from GPS and other geodetic results following large
trench thrust faulting earthquakes. For a number of years, sites
near the trench on the overriding plate move seaward, showing
σ
Time
a.
Stick-slip
E
η
v 0
b.
Stress
0
σ m
σ y
σ b
c.
Time
Displacement
0
v 0
u
v c
∆t
∆u
Lo n g -t e rm sh o rt e n in g ra te
I n s t a n t a n e o u s ( G
P S ) v e l o c i t y
Fig. 5.7-28 a: Model for a viscoelastic–plastic crust to describe the
response of the overriding South American plate to the subduction of
the Nazca plate. The dashpot represents a viscous body modeling the
permanent deformation, the spring represents an elastic body modeling
the transient deformation, and the frictional plates represent the
earthquake cycle at the trench. b: Stress evolution for the model.
c: Displacement history for the model. Displacement accumulates at the
instantaneous rate v 0 except during earthquakes, when slip ∆u occurs.
GPS data record a gradient starting at v 0 from the trench, whereas the
envelope of the displacement curve v c is the long-term shortening rate
reflected in geological records and topography. (Liu et al., 2000. Geophys.
Res. Lett., 18, 3005– 8, copyright by the American Geophysical Union.)
5.7 Faulting and deformation in the earth 365
postseismic motion consistent with the earthquake focal
mechanism (Fig. 4.5-15). Eventually, however, the sites resume
the landward interseismic motion usually seen at trenches
(Fig. 5.6-10). Such observations are challenging to interpret,
because postseismic afterslip on or near a fault can have effects
at the surface similar to viscoelastic flow of the asthenosphere
(Fig. 5.7-29), but offer the prospect of improving our understanding of both earthquake processes and the rheology of the
lithosphere and the asthenosphere. A tantalizing possibility is
that the viscous asthenosphere permits stress waves generated
by large earthquakes to travel slowly for large distances and
contribute to earthquake triggering.
to strain rate at any point, which is the vertically averaged
effective viscosity, varies significantly. Low values along the
San Andreas fault and western Great Basin show that the strain
rates are relatively high for the predicted stress, consistent with
a weak lower crust. The Great Valley–Sierra Nevada block has
little internal deformation, and thus acts relatively rigidly and
appears as a high-viscosity region. Summing seismic moment
tensors (Section 5.6.2) yields a seismic strain rate averaging
about 60% of the inferred total strain. As discussed earlier, this
discrepancy may indicate some aseismic deformation or that
the 150 years of historical seismicity is too short for a reliable
estimate.
Viscous fluid models can be used to study how the lithosphere deforms on different time scales. For example, as noted
in Section 5.6.2, GPS data across the entire Nazca–South
America plate boundary zone show faster motion than is
inferred from structural geology or topographic modeling.
The difference probably occurs because the GPS data record
instantaneous velocities that include both permanent deformation and elastic deformation that will be recovered during
future earthquakes, whereas the lower geological rates reflect
only the permanent deformation. This can be modeled by representing the overriding South American plate using a simple
one-dimensional system of a spring, a dashpot, and a pair of
frictional plates (Fig. 5.7-28). This system approximates the
behavior of the crust: the spring gives the elastic response over
short periods, the dashpot gives the viscous response over geological time scales, and the frictional plates simulate the thrust
faulting earthquake cycle at the trench. As plate convergence
compresses the system, the stress σ(t) increases with time
until it reaches a yield strength σ y , when an earthquake occurs,
stress drops to σ b , and the process repeats. Displacement
accumulates at a rate v 0 except during earthquakes, when the
displacement drops by an amount ∆u. The topography and
geologic data record the averaged long-term shortening rate v c
shown by the envelope of the sawtooth curve, whereas GPS
data record the higher instantaneous velocity v 0 . The instantaneous velocity thus results from the portion of the plate motion
locked at the trench that deforms the overriding plate elastically (Fig. 4.5-14) and is released as seismic slip in interplate
earthquakes. By contrast, the aseismic slip component at the
trench has no effect because it does not contribute to locking on
the interface and deformation of the overriding plate. Similar
models are being explored for other regions where deformation
appears to vary on different time scales.
Viscous fluid models are also used to analyze other aspects
of the earthquake cycle. For example, Fig. 5.7-29 shows the
strain rate near portions of the San Andreas fault compared to
the time since the last great earthquake on that portion of the
fault. Postseismic motion seems to continue for a period of
years after an earthquake and then slowly decays, presumably due to the steady interseismic motion. A similar picture
emerges from GPS and other geodetic results following large
trench thrust faulting earthquakes. For a number of years, sites
near the trench on the overriding plate move seaward, showing
σ
Time
a.
Stick-slip
E
η
v 0
b.
Stress
0
σ m
σ y
σ b
c.
Time
Displacement
0
v 0
u
v c
∆t
∆u
Lo n g -t e rm sh o rt e n in g ra te
I n s t a n t a n e o u s ( G
P S ) v e l o c i t y
Fig. 5.7-28 a: Model for a viscoelastic–plastic crust to describe the
response of the overriding South American plate to the subduction of
the Nazca plate. The dashpot represents a viscous body modeling the
permanent deformation, the spring represents an elastic body modeling
the transient deformation, and the frictional plates represent the
earthquake cycle at the trench. b: Stress evolution for the model.
c: Displacement history for the model. Displacement accumulates at the
instantaneous rate v 0 except during earthquakes, when slip ∆u occurs.
GPS data record a gradient starting at v 0 from the trench, whereas the
envelope of the displacement curve v c is the long-term shortening rate
reflected in geological records and topography. (Liu et al., 2000. Geophys.
Res. Lett., 18, 3005– 8, copyright by the American Geophysical Union.)
5.7 Faulting and deformation in the earth 365
postseismic motion consistent with the earthquake focal
mechanism (Fig. 4.5-15). Eventually, however, the sites resume
the landward interseismic motion usually seen at trenches
(Fig. 5.6-10). Such observations are challenging to interpret,
because postseismic afterslip on or near a fault can have effects
at the surface similar to viscoelastic flow of the asthenosphere
(Fig. 5.7-29), but offer the prospect of improving our understanding of both earthquake processes and the rheology of the
lithosphere and the asthenosphere. A tantalizing possibility is
that the viscous asthenosphere permits stress waves generated
by large earthquakes to travel slowly for large distances and
contribute to earthquake triggering.