

many of which seem to act for only a few earthquake cycles,
and others of which may be one-time events. Research, some
of which is discussed in Section 5.7, is going on to investigate
this complexity.
Even with the dates of previous major earthquakes, it is difficult to predict when the next will occur, as illustrated by the
segment of the San Andreas fault near Parkfield, California.
Compared to the southern segment just discussed, or the northern segment on which the 1906 earthquake occurred, the
Parkfield segment is characterized by smaller earthquakes that
occur more frequently and appear much more periodic. Earthquakes of magnitude 5–6 occurred in 1857, 1881, 1901, 1922,
1934, and 1966. The average recurrence interval is 22 years,
and a linear fit to these dates made 1988 the likely date of the
next event. In 1985, it was predicted at the 95% confidence
level that the next Parkfield earthquake would occur before
1993, which was the USA’s first official earthquake prediction.
A comprehensive observing system was set up to monitor electrical resistivity, magnetic field strength, seismic wave velocity,
microseismicity, ground tilting, water well levels and chemistry (especially radon content), and motion across the fault.
The well-publicized experiment 10 hoped to observe precursory
behavior, which seemed likely because surface cracks were
observed 10 days before the 1966 earthquake and a pipeline
ruptured 9 hours before the shock, and to obtain detailed
records of the earthquake at short distances. As of 2002, the
earthquake had not yet happened, making the current interval
(35 years and growing) the longest yet observed between earthquakes there. The next Parkfield earthquake will eventually
occur, but its non-arrival to date illustrates both the limitations
of the statistical approaches used in the prediction (including
the omission of the 1934 earthquake on the grounds that it
was premature and should have occurred in 1944) and the fact
that even in the best of circumstances nature is not necessarily
cooperative or easily predicted. For that matter, it is unclear
whether the Parkfield segment of the San Andreas fault shows
such unusual quasi-periodicity because it differs from other
parts of the San Andreas fault (in which case predicting earthquakes there might not be that helpful for other parts), or
whether it results simply from the fact that, given enough time
and different fault segments, essentially random seismicity can
yield apparent periodicity somewhere. As is usual with such
questions, only time will tell.
Such seismic forecasting involves the concept of seismic
gaps, discussed further in Sections 4.7.3 and 5.4.3. The idea is
that a long plate boundary like the San Andreas or an oceanic
trench ruptures in segments. We would thus expect steady plate
motion to cause earthquakes that fill in gaps and occur at
relatively regular intervals. However, the Pallett Creek and
Date (AD)
2000
1900
1800
1700
1600
1500
1400
1300
1200
1100
1000
900
800
700
600
500
Pallett Creek
(164–328 yr) between cluster
(102–66 yr) cluster 3
(317–47 yr) between cluster
44 yr cluster 4 (historic)
1857
1812
(22–184 yr) cluster 2
(162–238 yr) between cluster
(91–161 yr) cluster 1
Los Angeles
C a l i f o r n i a
S A F
range of date
earthquake event
cluster (max time)
1480
1346
1100
1048
997
797
734
671
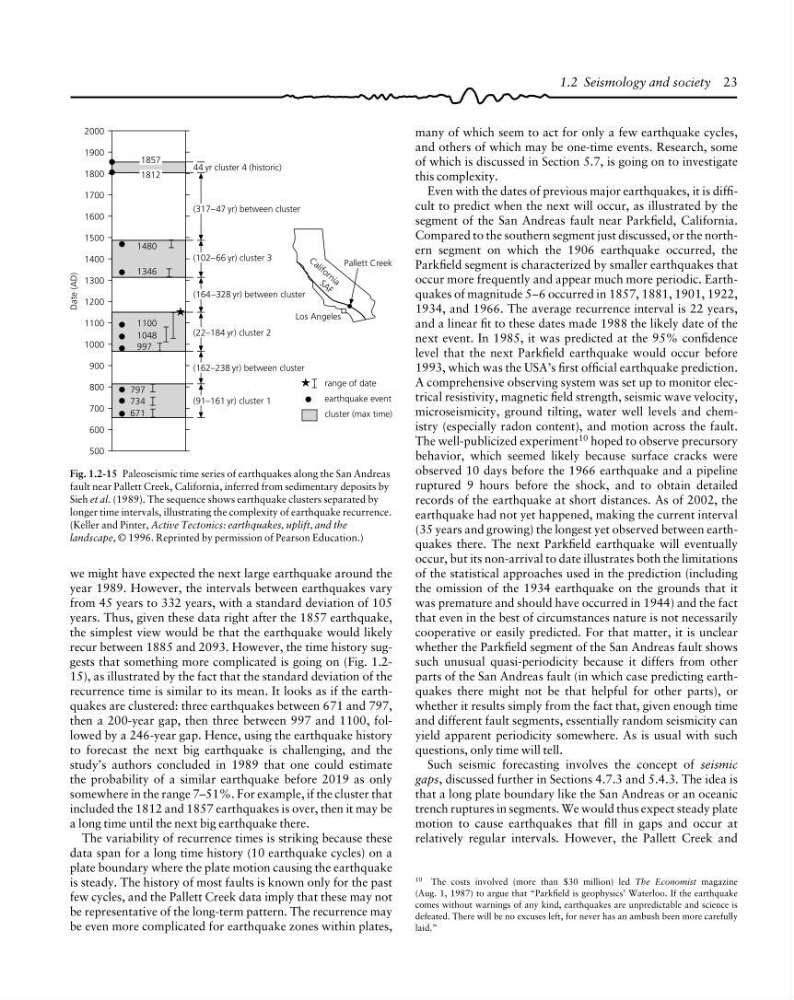
Fig. 1.2-15 Paleoseismic time series of earthquakes along the San Andreas
fault near Pallett Creek, California, inferred from sedimentary deposits by
Sieh et al. (1989). The sequence shows earthquake clusters separated by
longer time intervals, illustrating the complexity of earthquake recurrence.
(Keller and Pinter, Active Tectonics: earthquakes, uplift, and the
landscape, © 1996. Reprinted by permission of Pearson Education.)
10 The costs involved (more than $30 million) led The Economist magazine
(Aug. 1, 1987) to argue that “Parkfield is geophysics’ Waterloo. If the earthquake
comes without warnings of any kind, earthquakes are unpredictable and science is
defeated. There will be no excuses left, for never has an ambush been more carefully
laid.”
we might have expected the next large earthquake around the
year 1989. However, the intervals between earthquakes vary
from 45 years to 332 years, with a standard deviation of 105
years. Thus, given these data right after the 1857 earthquake,
the simplest view would be that the earthquake would likely
recur between 1885 and 2093. However, the time history suggests that something more complicated is going on (Fig. 1.215), as illustrated by the fact that the standard deviation of the
recurrence time is similar to its mean. It looks as if the earthquakes are clustered: three earthquakes between 671 and 797,
then a 200-year gap, then three between 997 and 1100, followed by a 246-year gap. Hence, using the earthquake history
to forecast the next big earthquake is challenging, and the
study’s authors concluded in 1989 that one could estimate
the probability of a similar earthquake before 2019 as only
somewhere in the range 7–51%. For example, if the cluster that
included the 1812 and 1857 earthquakes is over, then it may be
a long time until the next big earthquake there.
The variability of recurrence times is striking because these
data span for a long time history (10 earthquake cycles) on a
plate boundary where the plate motion causing the earthquake
is steady. The history of most faults is known only for the past
few cycles, and the Pallett Creek data imply that these may not
be representative of the long-term pattern. The recurrence may
be even more complicated for earthquake zones within plates,
1.2 Seismology and society 23
and others of which may be one-time events. Research, some
of which is discussed in Section 5.7, is going on to investigate
this complexity.
Even with the dates of previous major earthquakes, it is difficult to predict when the next will occur, as illustrated by the
segment of the San Andreas fault near Parkfield, California.
Compared to the southern segment just discussed, or the northern segment on which the 1906 earthquake occurred, the
Parkfield segment is characterized by smaller earthquakes that
occur more frequently and appear much more periodic. Earthquakes of magnitude 5–6 occurred in 1857, 1881, 1901, 1922,
1934, and 1966. The average recurrence interval is 22 years,
and a linear fit to these dates made 1988 the likely date of the
next event. In 1985, it was predicted at the 95% confidence
level that the next Parkfield earthquake would occur before
1993, which was the USA’s first official earthquake prediction.
A comprehensive observing system was set up to monitor electrical resistivity, magnetic field strength, seismic wave velocity,
microseismicity, ground tilting, water well levels and chemistry (especially radon content), and motion across the fault.
The well-publicized experiment 10 hoped to observe precursory
behavior, which seemed likely because surface cracks were
observed 10 days before the 1966 earthquake and a pipeline
ruptured 9 hours before the shock, and to obtain detailed
records of the earthquake at short distances. As of 2002, the
earthquake had not yet happened, making the current interval
(35 years and growing) the longest yet observed between earthquakes there. The next Parkfield earthquake will eventually
occur, but its non-arrival to date illustrates both the limitations
of the statistical approaches used in the prediction (including
the omission of the 1934 earthquake on the grounds that it
was premature and should have occurred in 1944) and the fact
that even in the best of circumstances nature is not necessarily
cooperative or easily predicted. For that matter, it is unclear
whether the Parkfield segment of the San Andreas fault shows
such unusual quasi-periodicity because it differs from other
parts of the San Andreas fault (in which case predicting earthquakes there might not be that helpful for other parts), or
whether it results simply from the fact that, given enough time
and different fault segments, essentially random seismicity can
yield apparent periodicity somewhere. As is usual with such
questions, only time will tell.
Such seismic forecasting involves the concept of seismic
gaps, discussed further in Sections 4.7.3 and 5.4.3. The idea is
that a long plate boundary like the San Andreas or an oceanic
trench ruptures in segments. We would thus expect steady plate
motion to cause earthquakes that fill in gaps and occur at
relatively regular intervals. However, the Pallett Creek and
Date (AD)
2000
1900
1800
1700
1600
1500
1400
1300
1200
1100
1000
900
800
700
600
500
Pallett Creek
(164–328 yr) between cluster
(102–66 yr) cluster 3
(317–47 yr) between cluster
44 yr cluster 4 (historic)
1857
1812
(22–184 yr) cluster 2
(162–238 yr) between cluster
(91–161 yr) cluster 1
Los Angeles
C a l i f o r n i a
S A F
range of date
earthquake event
cluster (max time)
1480
1346
1100
1048
997
797
734
671
Fig. 1.2-15 Paleoseismic time series of earthquakes along the San Andreas
fault near Pallett Creek, California, inferred from sedimentary deposits by
Sieh et al. (1989). The sequence shows earthquake clusters separated by
longer time intervals, illustrating the complexity of earthquake recurrence.
(Keller and Pinter, Active Tectonics: earthquakes, uplift, and the
landscape, © 1996. Reprinted by permission of Pearson Education.)
10 The costs involved (more than $30 million) led The Economist magazine
(Aug. 1, 1987) to argue that “Parkfield is geophysics’ Waterloo. If the earthquake
comes without warnings of any kind, earthquakes are unpredictable and science is
defeated. There will be no excuses left, for never has an ambush been more carefully
laid.”
we might have expected the next large earthquake around the
year 1989. However, the intervals between earthquakes vary
from 45 years to 332 years, with a standard deviation of 105
years. Thus, given these data right after the 1857 earthquake,
the simplest view would be that the earthquake would likely
recur between 1885 and 2093. However, the time history suggests that something more complicated is going on (Fig. 1.215), as illustrated by the fact that the standard deviation of the
recurrence time is similar to its mean. It looks as if the earthquakes are clustered: three earthquakes between 671 and 797,
then a 200-year gap, then three between 997 and 1100, followed by a 246-year gap. Hence, using the earthquake history
to forecast the next big earthquake is challenging, and the
study’s authors concluded in 1989 that one could estimate
the probability of a similar earthquake before 2019 as only
somewhere in the range 7–51%. For example, if the cluster that
included the 1812 and 1857 earthquakes is over, then it may be
a long time until the next big earthquake there.
The variability of recurrence times is striking because these
data span for a long time history (10 earthquake cycles) on a
plate boundary where the plate motion causing the earthquake
is steady. The history of most faults is known only for the past
few cycles, and the Pallett Creek data imply that these may not
be representative of the long-term pattern. The recurrence may
be even more complicated for earthquake zones within plates,
1.2 Seismology and society 23