

22 Introduction
This idea implies that the history of large past earthquakes
in an area should indicate the probable time of the next one.
Naturally, the longer the history available, the better. Unfortunately, the duration of earthquake cycles is typically long compared to the approximately 100-year history of instrumental
seismology. In some parts of the world, like China and Japan,
historical records extend well into the past, whereas in the
USA, the historic record is shorter. The earthquake history can
be extended by paleoseismology, a branch of geology that
studies the past history of faults. One of the best examples is the
use of geological data to infer the history of large earthquakes
on a major southern segment of the San Andreas fault. The last
major earthquake recorded at a site at Pallett Creek, California, the 1857 Fort Tejon earthquake, is known from historical
records to have caused shaking with an intensity of XI. The
faulting is recorded by disruptions of sedimentary strata,
including sand blows where material erupted during the
earthquake. Sand blows and other structures from previous
earthquakes were dated with radiometric carbon-14 methods,
giving the dates of previous earthquakes. Despite the many
uncertainties involved with these methods, including uncertainties in radiometric dating and the effects of climate variations and burrowing animals, the data show that faulting has
recurred over the past thousands of years. However, assessing
the size of past earthquakes and whether some earthquakes
were missed is difficult.
The results can be surprising. For instance, large earthquakes
near Pallett Creek appear to have occurred approximately in
the years 1857, 1812, 1480, 1346, 1100, 1048, 997, 797, 734,
and 671. Because the average time between events is 132 years,
268˚
272˚
36˚
40˚
0 . 5
0 .5
1
1 . 5
2
0 . 2
0.3
0.3
0 . 5
0 .5
0 . 7 5
1
St. Louis
Memphis
Frankel M8/1000 yr
268˚
272˚
36˚
40˚
0 .5
1
0 . 2
0 .3
0 . 3
0 .3
0 .5
0 .7 5
1
St. Louis
Memphis
Frankel M7/1000 yr
268˚
272˚
36˚
40˚
0 . 5
1
1 . 5
2
0. 1
0.1
0. 2
0 . 2
0 . 3
0 .3
0 . 5
0 . 7 5
1
St. Louis
Memphis
Toro M8/1000 yr
268˚
272˚
36˚
40˚
0 .5
0 . 1
0 .1
0.2
0
.
2
0 . 3
0 .5
0 . 7 5
St. Louis
Memphis
Toro M7/1000 yr
0.0
0.5
1.0
1.5
2.0
M max Effect
Ground Motion Effect
Peak Ground Acceleration (g)
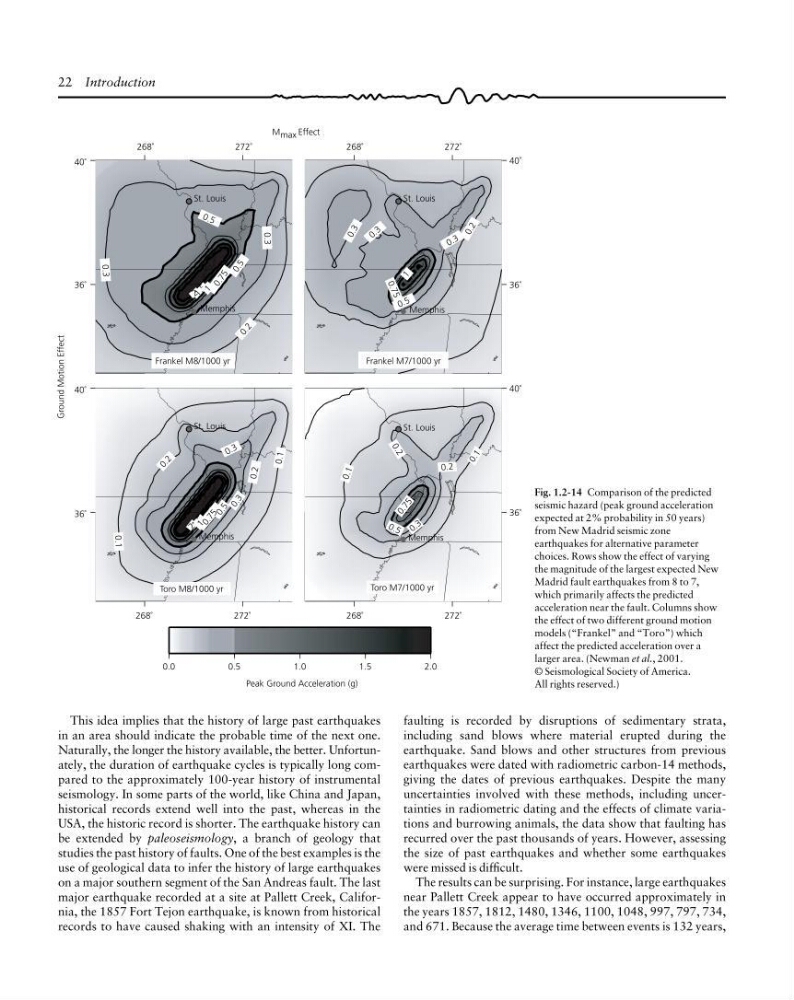
Fig. 1.2-14 Comparison of the predicted
seismic hazard (peak ground acceleration
expected at 2% probability in 50 years)
from New Madrid seismic zone
earthquakes for alternative parameter
choices. Rows show the effect of varying
the magnitude of the largest expected New
Madrid fault earthquakes from 8 to 7,
which primarily affects the predicted
acceleration near the fault. Columns show
the effect of two different ground motion
models (“Frankel” and “Toro”) which
affect the predicted acceleration over a
larger area. (Newman et al., 2001.
© Seismological Society of America.
All rights reserved.)
This idea implies that the history of large past earthquakes
in an area should indicate the probable time of the next one.
Naturally, the longer the history available, the better. Unfortunately, the duration of earthquake cycles is typically long compared to the approximately 100-year history of instrumental
seismology. In some parts of the world, like China and Japan,
historical records extend well into the past, whereas in the
USA, the historic record is shorter. The earthquake history can
be extended by paleoseismology, a branch of geology that
studies the past history of faults. One of the best examples is the
use of geological data to infer the history of large earthquakes
on a major southern segment of the San Andreas fault. The last
major earthquake recorded at a site at Pallett Creek, California, the 1857 Fort Tejon earthquake, is known from historical
records to have caused shaking with an intensity of XI. The
faulting is recorded by disruptions of sedimentary strata,
including sand blows where material erupted during the
earthquake. Sand blows and other structures from previous
earthquakes were dated with radiometric carbon-14 methods,
giving the dates of previous earthquakes. Despite the many
uncertainties involved with these methods, including uncertainties in radiometric dating and the effects of climate variations and burrowing animals, the data show that faulting has
recurred over the past thousands of years. However, assessing
the size of past earthquakes and whether some earthquakes
were missed is difficult.
The results can be surprising. For instance, large earthquakes
near Pallett Creek appear to have occurred approximately in
the years 1857, 1812, 1480, 1346, 1100, 1048, 997, 797, 734,
and 671. Because the average time between events is 132 years,
268˚
272˚
36˚
40˚
0 . 5
0 .5
1
1 . 5
2
0 . 2
0.3
0.3
0 . 5
0 .5
0 . 7 5
1
St. Louis
Memphis
Frankel M8/1000 yr
268˚
272˚
36˚
40˚
0 .5
1
0 . 2
0 .3
0 . 3
0 .3
0 .5
0 .7 5
1
St. Louis
Memphis
Frankel M7/1000 yr
268˚
272˚
36˚
40˚
0 . 5
1
1 . 5
2
0. 1
0.1
0. 2
0 . 2
0 . 3
0 .3
0 . 5
0 . 7 5
1
St. Louis
Memphis
Toro M8/1000 yr
268˚
272˚
36˚
40˚
0 .5
0 . 1
0 .1
0.2
0
.
2
0 . 3
0 .5
0 . 7 5
St. Louis
Memphis
Toro M7/1000 yr
0.0
0.5
1.0
1.5
2.0
M max Effect
Ground Motion Effect
Peak Ground Acceleration (g)
Fig. 1.2-14 Comparison of the predicted
seismic hazard (peak ground acceleration
expected at 2% probability in 50 years)
from New Madrid seismic zone
earthquakes for alternative parameter
choices. Rows show the effect of varying
the magnitude of the largest expected New
Madrid fault earthquakes from 8 to 7,
which primarily affects the predicted
acceleration near the fault. Columns show
the effect of two different ground motion
models (“Frankel” and “Toro”) which
affect the predicted acceleration over a
larger area. (Newman et al., 2001.
© Seismological Society of America.
All rights reserved.)