

Depth (km)
0
10
20
30
40
50
−1500
Olivine
Quartz
−1000
−500
0
500
B Y - H Y D
= 0 . 4 2
λ
D R Y = 0
λ
= 0 . 7
λ
= 1
λ
= 0. 7
λ
B Y - H Y D
= 0 .4 2
λ
D R Y
=
0
λ
H − V (MPa)
σ
σ
Extension
Compression
is stronger at higher strain rates, and weakens exponentially
with high temperatures. At shallow depths, the small pressure
effect is often neglected, so the activation volume V* is treated
as zero. For example, a commonly used flow law for dry olivine
is
6
G = 7 × 10 4 |σ 1 − σ 3 | 3 exp
.
−
⎛
⎝
⎜
⎞
⎠
⎟
0 52 MJ/mol
RT
for | σ 1 − σ 3 | ≤ 200 MPa
= 5.7 × 10 11 exp
.
[
]
−
−
−
⎛
⎝
⎜
⎞
⎠
⎟
⎡
⎣
⎢
⎢
⎢
⎤
⎦
⎥
⎥
⎥
0 54
1
8500
1
2
2
MJ/mol
RT
σ
σ
for | σ 1 − σ 3 | > 200 MPa,
(39)
where G is in s −1 . Similarly, for quartz,
G = 5 × 10 6 |σ 1 − σ 3 | 3 exp
.
−
⎛
⎝
⎜
⎞
⎠
⎟
0 19 MJ/mol
RT
for | σ 1 − σ 3 | < 1000 MPa.
(40)
At a given strain rate, quartz is much weaker (can sustain a
smaller stress difference) than olivine. Thus the quartz-rich
continental crust should be weaker that the olivine-rich oceanic
crust, an effect whose tectonic consequences are discussed
next.
5.7.4 Strength of the lithosphere
The strength of the lithosphere as a function of depth depends
upon the deformation mechanism. At shallow depths, rocks
fail by either brittle fracture or frictional sliding on preexisting
faults. Both processes depend in a similar way on the normal
stress, with rock strength increasing with depth. However, at
greater depths the ductile flow strength of rocks is less than the
brittle or frictional strength, so the strength is given by the flow
laws and decreases with depth as the temperatures increase.
This temperature-dependent strength is the reason why the
cold lithosphere forms the planet’s strong outer layer.
To calculate the strength, a strain rate and a geotherm giving
temperature as a function of depth are assumed. At shallow
depths the strength, the maximum stress difference before
frictional sliding occurs, is computed using Eqns 27 and 28. At
some depth, the frictional strength exceeds the ductile strength
allowed by the flow law, so for deeper depths the maximum
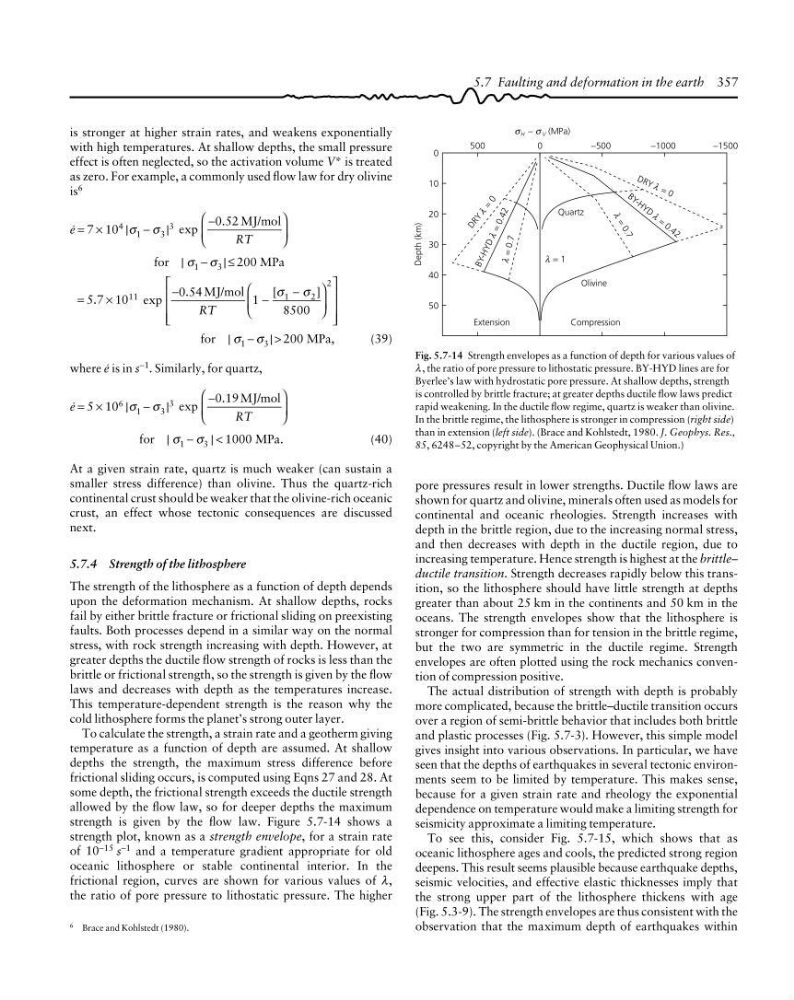
strength is given by the flow law. Figure 5.7-14 shows a
strength plot, known as a strength envelope, for a strain rate
of 10 −15 s −1 and a temperature gradient appropriate for old
oceanic lithosphere or stable continental interior. In the
frictional region, curves are shown for various values of λ,
the ratio of pore pressure to lithostatic pressure. The higher
6 Brace and Kohlstedt (1980).
Fig. 5.7-14 Strength envelopes as a function of depth for various values of
λ , the ratio of pore pressure to lithostatic pressure. BY-HYD lines are for
Byerlee’s law with hydrostatic pore pressure. At shallow depths, strength
is controlled by brittle fracture; at greater depths ductile flow laws predict
rapid weakening. In the ductile flow regime, quartz is weaker than olivine.
In the brittle regime, the lithosphere is stronger in compression (right side)
than in extension (left side). (Brace and Kohlstedt, 1980. J. Geophys. Res.,
85, 6248–52, copyright by the American Geophysical Union.)
pore pressures result in lower strengths. Ductile flow laws are
shown for quartz and olivine, minerals often used as models for
continental and oceanic rheologies. Strength increases with
depth in the brittle region, due to the increasing normal stress,
and then decreases with depth in the ductile region, due to
increasing temperature. Hence strength is highest at the brittle–
ductile transition. Strength decreases rapidly below this transition, so the lithosphere should have little strength at depths
greater than about 25 km in the continents and 50 km in the
oceans. The strength envelopes show that the lithosphere is
stronger for compression than for tension in the brittle regime,
but the two are symmetric in the ductile regime. Strength
envelopes are often plotted using the rock mechanics convention of compression positive.
The actual distribution of strength with depth is probably
more complicated, because the brittle–ductile transition occurs
over a region of semi-brittle behavior that includes both brittle
and plastic processes (Fig. 5.7-3). However, this simple model
gives insight into various observations. In particular, we have
seen that the depths of earthquakes in several tectonic environments seem to be limited by temperature. This makes sense,
because for a given strain rate and rheology the exponential
dependence on temperature would make a limiting strength for
seismicity approximate a limiting temperature.
To see this, consider Fig. 5.7-15, which shows that as
oceanic lithosphere ages and cools, the predicted strong region
deepens. This result seems plausible because earthquake depths,
seismic velocities, and effective elastic thicknesses imply that
the strong upper part of the lithosphere thickens with age
(Fig. 5.3-9). The strength envelopes are thus consistent with the
observation that the maximum depth of earthquakes within
5.7 Faulting and deformation in the earth 357
0
10
20
30
40
50
−1500
Olivine
Quartz
−1000
−500
0
500
B Y - H Y D
= 0 . 4 2
λ
D R Y = 0
λ
= 0 . 7
λ
= 1
λ
= 0. 7
λ
B Y - H Y D
= 0 .4 2
λ
D R Y
=
0
λ
H − V (MPa)
σ
σ
Extension
Compression
is stronger at higher strain rates, and weakens exponentially
with high temperatures. At shallow depths, the small pressure
effect is often neglected, so the activation volume V* is treated
as zero. For example, a commonly used flow law for dry olivine
is
6
G = 7 × 10 4 |σ 1 − σ 3 | 3 exp
.
−
⎛
⎝
⎜
⎞
⎠
⎟
0 52 MJ/mol
RT
for | σ 1 − σ 3 | ≤ 200 MPa
= 5.7 × 10 11 exp
.
[
]
−
−
−
⎛
⎝
⎜
⎞
⎠
⎟
⎡
⎣
⎢
⎢
⎢
⎤
⎦
⎥
⎥
⎥
0 54
1
8500
1
2
2
MJ/mol
RT
σ
σ
for | σ 1 − σ 3 | > 200 MPa,
(39)
where G is in s −1 . Similarly, for quartz,
G = 5 × 10 6 |σ 1 − σ 3 | 3 exp
.
−
⎛
⎝
⎜
⎞
⎠
⎟
0 19 MJ/mol
RT
for | σ 1 − σ 3 | < 1000 MPa.
(40)
At a given strain rate, quartz is much weaker (can sustain a
smaller stress difference) than olivine. Thus the quartz-rich
continental crust should be weaker that the olivine-rich oceanic
crust, an effect whose tectonic consequences are discussed
next.
5.7.4 Strength of the lithosphere
The strength of the lithosphere as a function of depth depends
upon the deformation mechanism. At shallow depths, rocks
fail by either brittle fracture or frictional sliding on preexisting
faults. Both processes depend in a similar way on the normal
stress, with rock strength increasing with depth. However, at
greater depths the ductile flow strength of rocks is less than the
brittle or frictional strength, so the strength is given by the flow
laws and decreases with depth as the temperatures increase.
This temperature-dependent strength is the reason why the
cold lithosphere forms the planet’s strong outer layer.
To calculate the strength, a strain rate and a geotherm giving
temperature as a function of depth are assumed. At shallow
depths the strength, the maximum stress difference before
frictional sliding occurs, is computed using Eqns 27 and 28. At
some depth, the frictional strength exceeds the ductile strength
allowed by the flow law, so for deeper depths the maximum
strength is given by the flow law. Figure 5.7-14 shows a
strength plot, known as a strength envelope, for a strain rate
of 10 −15 s −1 and a temperature gradient appropriate for old
oceanic lithosphere or stable continental interior. In the
frictional region, curves are shown for various values of λ,
the ratio of pore pressure to lithostatic pressure. The higher
6 Brace and Kohlstedt (1980).
Fig. 5.7-14 Strength envelopes as a function of depth for various values of
λ , the ratio of pore pressure to lithostatic pressure. BY-HYD lines are for
Byerlee’s law with hydrostatic pore pressure. At shallow depths, strength
is controlled by brittle fracture; at greater depths ductile flow laws predict
rapid weakening. In the ductile flow regime, quartz is weaker than olivine.
In the brittle regime, the lithosphere is stronger in compression (right side)
than in extension (left side). (Brace and Kohlstedt, 1980. J. Geophys. Res.,
85, 6248–52, copyright by the American Geophysical Union.)
pore pressures result in lower strengths. Ductile flow laws are
shown for quartz and olivine, minerals often used as models for
continental and oceanic rheologies. Strength increases with
depth in the brittle region, due to the increasing normal stress,
and then decreases with depth in the ductile region, due to
increasing temperature. Hence strength is highest at the brittle–
ductile transition. Strength decreases rapidly below this transition, so the lithosphere should have little strength at depths
greater than about 25 km in the continents and 50 km in the
oceans. The strength envelopes show that the lithosphere is
stronger for compression than for tension in the brittle regime,
but the two are symmetric in the ductile regime. Strength
envelopes are often plotted using the rock mechanics convention of compression positive.
The actual distribution of strength with depth is probably
more complicated, because the brittle–ductile transition occurs
over a region of semi-brittle behavior that includes both brittle
and plastic processes (Fig. 5.7-3). However, this simple model
gives insight into various observations. In particular, we have
seen that the depths of earthquakes in several tectonic environments seem to be limited by temperature. This makes sense,
because for a given strain rate and rheology the exponential
dependence on temperature would make a limiting strength for
seismicity approximate a limiting temperature.
To see this, consider Fig. 5.7-15, which shows that as
oceanic lithosphere ages and cools, the predicted strong region
deepens. This result seems plausible because earthquake depths,
seismic velocities, and effective elastic thicknesses imply that
the strong upper part of the lithosphere thickens with age
(Fig. 5.3-9). The strength envelopes are thus consistent with the
observation that the maximum depth of earthquakes within
5.7 Faulting and deformation in the earth 357