

5.7 Faulting and deformation in the earth 351
2000
1500
1000
500
0
2000
1500
1000
500
0
Differential stress (MPa)
P = plasticity
M = microfracturing
F = faulting
Strain rate = 1.1 × 10
−5 s
−1
Temperature = 600°C
Confining pressure, MPa
F
F
M + P
M + P
M + P
P
P
2000
1390
1000
730
500
380
170
0
5
10
15
20
Strain (%)
Differential stress (MPa)
0
500
1000
1500
2000
Confining pressure (MPa)
Brittle
Faulting
Microfracturing +
Plasticity
Plasticity
Semi-brittle
Ductile
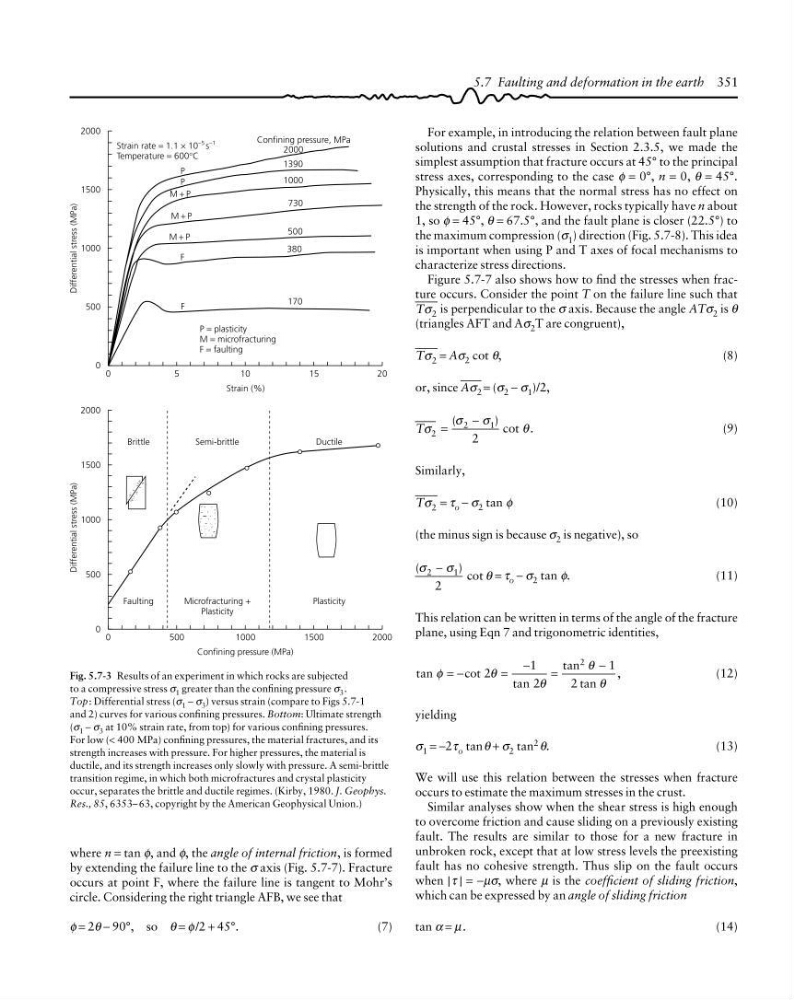
Fig. 5.7-3 Results of an experiment in which rocks are subjected
to a compressive stress σ 1 greater than the confining pressure σ 3 .
Top: Differential stress (σ 1 − σ 3 ) versus strain (compare to Figs 5.7-1
and 2) curves for various confining pressures. Bottom: Ultimate strength
(σ 1 − σ 3 at 10% strain rate, from top) for various confining pressures.
For low (< 400 MPa) confining pressures, the material fractures, and its
strength increases with pressure. For higher pressures, the material is
ductile, and its strength increases only slowly with pressure. A semi-brittle
transition regime, in which both microfractures and crystal plasticity
occur, separates the brittle and ductile regimes. (Kirby, 1980. J. Geophys.
Res., 85, 6353– 63, copyright by the American Geophysical Union.)
For example, in introducing the relation between fault plane
solutions and crustal stresses in Section 2.3.5, we made the
simplest assumption that fracture occurs at 45° to the principal
stress axes, corresponding to the case φ = 0°, n = 0, θ = 45°.
Physically, this means that the normal stress has no effect on
the strength of the rock. However, rocks typically have n about
1, so φ = 45°, θ = 67.5°, and the fault plane is closer (22.5°) to
the maximum compression (σ 1 ) direction (Fig. 5.7-8). This idea
is important when using P and T axes of focal mechanisms to
characterize stress directions.
Figure 5.7-7 also shows how to find the stresses when fracture occurs. Consider the point T on the failure line such that
Tσ 2 is perpendicular to the σ axis. Because the angle ATσ 2 is θ
(triangles AFT and Aσ 2 T are congruent),
Tσ 2 = Aσ 2 cot θ,
(8)
or, since Aσ 2 = (σ 2 − σ 1 )/2,
Tσ 2 =
−
(
) cot .
σ
σ
θ
2
1
2
(9)
Similarly,
Tσ 2 = τ o − σ 2 tan φ
(10)
(the minus sign is because σ 2 is negative), so
(
) cot
σ
σ
θ
2
1
2
−
= τ o − σ 2 tan φ.
(11)
This relation can be written in terms of the angle of the fracture
plane, using Eqn 7 and trigonometric identities,
tan
cot
tan
tan
tan
,
φ
θ
θ
θ
θ
= −
=
−
=
−
2
1
2
1
2
2
(12)
yielding
σ 1 = −2τ o tanθ + σ 2 tan 2 θ.
(13)
We will use this relation between the stresses when fracture
occurs to estimate the maximum stresses in the crust.
Similar analyses show when the shear stress is high enough
to overcome friction and cause sliding on a previously existing
fault. The results are similar to those for a new fracture in
unbroken rock, except that at low stress levels the preexisting
fault has no cohesive strength. Thus slip on the fault occurs
when |τ | = −µσ, where µ is the coefficient of sliding friction,
which can be expressed by an angle of sliding friction
tan α = µ .
(14)
where n = tan φ, and φ, the angle of internal friction, is formed
by extending the failure line to the σ axis (Fig. 5.7-7). Fracture
occurs at point F, where the failure line is tangent to Mohr’s
circle. Considering the right triangle AFB, we see that
φ = 2θ − 90°, so θ = φ /2 + 45°.
(7)
2000
1500
1000
500
0
2000
1500
1000
500
0
Differential stress (MPa)
P = plasticity
M = microfracturing
F = faulting
Strain rate = 1.1 × 10
−5 s
−1
Temperature = 600°C
Confining pressure, MPa
F
F
M + P
M + P
M + P
P
P
2000
1390
1000
730
500
380
170
0
5
10
15
20
Strain (%)
Differential stress (MPa)
0
500
1000
1500
2000
Confining pressure (MPa)
Brittle
Faulting
Microfracturing +
Plasticity
Plasticity
Semi-brittle
Ductile
Fig. 5.7-3 Results of an experiment in which rocks are subjected
to a compressive stress σ 1 greater than the confining pressure σ 3 .
Top: Differential stress (σ 1 − σ 3 ) versus strain (compare to Figs 5.7-1
and 2) curves for various confining pressures. Bottom: Ultimate strength
(σ 1 − σ 3 at 10% strain rate, from top) for various confining pressures.
For low (< 400 MPa) confining pressures, the material fractures, and its
strength increases with pressure. For higher pressures, the material is
ductile, and its strength increases only slowly with pressure. A semi-brittle
transition regime, in which both microfractures and crystal plasticity
occur, separates the brittle and ductile regimes. (Kirby, 1980. J. Geophys.
Res., 85, 6353– 63, copyright by the American Geophysical Union.)
For example, in introducing the relation between fault plane
solutions and crustal stresses in Section 2.3.5, we made the
simplest assumption that fracture occurs at 45° to the principal
stress axes, corresponding to the case φ = 0°, n = 0, θ = 45°.
Physically, this means that the normal stress has no effect on
the strength of the rock. However, rocks typically have n about
1, so φ = 45°, θ = 67.5°, and the fault plane is closer (22.5°) to
the maximum compression (σ 1 ) direction (Fig. 5.7-8). This idea
is important when using P and T axes of focal mechanisms to
characterize stress directions.
Figure 5.7-7 also shows how to find the stresses when fracture occurs. Consider the point T on the failure line such that
Tσ 2 is perpendicular to the σ axis. Because the angle ATσ 2 is θ
(triangles AFT and Aσ 2 T are congruent),
Tσ 2 = Aσ 2 cot θ,
(8)
or, since Aσ 2 = (σ 2 − σ 1 )/2,
Tσ 2 =
−
(
) cot .
σ
σ
θ
2
1
2
(9)
Similarly,
Tσ 2 = τ o − σ 2 tan φ
(10)
(the minus sign is because σ 2 is negative), so
(
) cot
σ
σ
θ
2
1
2
−
= τ o − σ 2 tan φ.
(11)
This relation can be written in terms of the angle of the fracture
plane, using Eqn 7 and trigonometric identities,
tan
cot
tan
tan
tan
,
φ
θ
θ
θ
θ
= −
=
−
=
−
2
1
2
1
2
2
(12)
yielding
σ 1 = −2τ o tanθ + σ 2 tan 2 θ.
(13)
We will use this relation between the stresses when fracture
occurs to estimate the maximum stresses in the crust.
Similar analyses show when the shear stress is high enough
to overcome friction and cause sliding on a previously existing
fault. The results are similar to those for a new fracture in
unbroken rock, except that at low stress levels the preexisting
fault has no cohesive strength. Thus slip on the fault occurs
when |τ | = −µσ, where µ is the coefficient of sliding friction,
which can be expressed by an angle of sliding friction
tan α = µ .
(14)
where n = tan φ, and φ, the angle of internal friction, is formed
by extending the failure line to the σ axis (Fig. 5.7-7). Fracture
occurs at point F, where the failure line is tangent to Mohr’s
circle. Considering the right triangle AFB, we see that
φ = 2θ − 90°, so θ = φ /2 + 45°.
(7)