

350 Seismology and Plate Tectonics
σ f
(a)
Stress,
σ
Fracture
Elastic
Strain, e
σ o
(b)
Stress,
σ
Elastic
Strain, e
Plastic
σ o
(c)
Stress,
σ
Strain, e
Plastic
σ o ′
Permanent
strain
Recoverable
elastic
strain
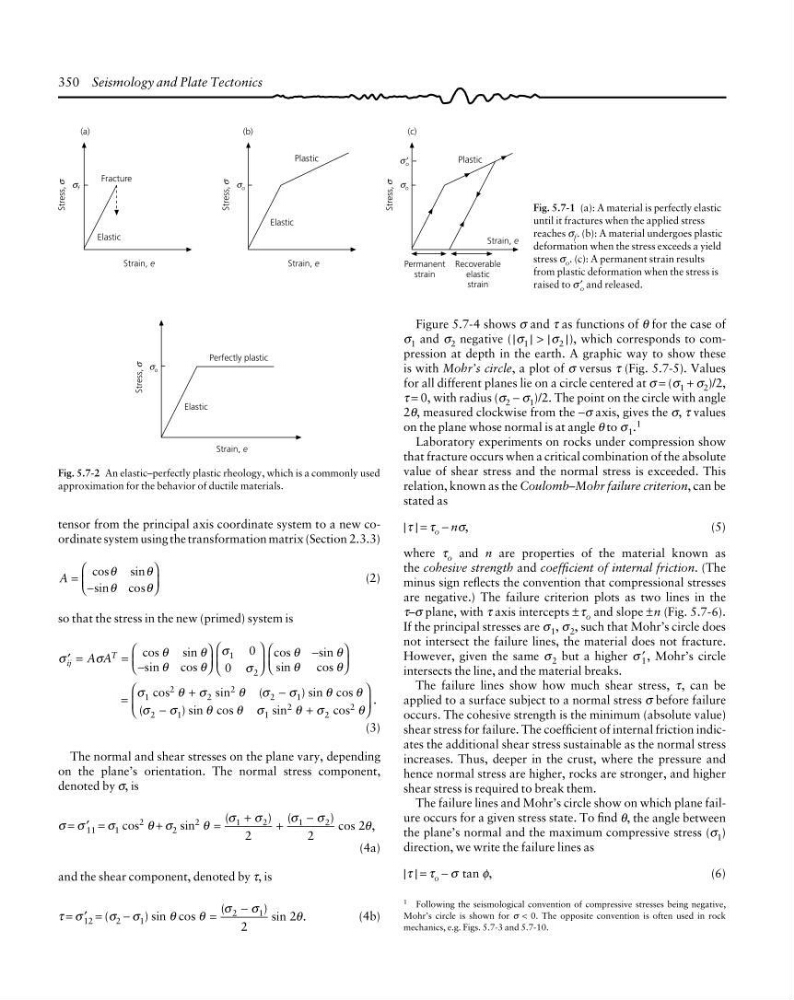
Fig. 5.7-1 (a): A material is perfectly elastic
until it fractures when the applied stress
reaches σ f . (b): A material undergoes plastic
deformation when the stress exceeds a yield
stress σ o . (c): A permanent strain results
from plastic deformation when the stress is
raised to σ ′ o and released.
Fig. 5.7-2 An elastic–perfectly plastic rheology, which is a commonly used
approximation for the behavior of ductile materials.
Stress,
σ
σ o
Perfectly plastic
Elastic
Strain, e
tensor from the principal axis coordinate system to a new coordinate system using the transformation matrix (Section 2.3.3)
A
cos
sin
sin
cos
= −
⎛
⎝
⎜
⎞
⎠
⎟
θ
θ
θ
θ
(2)
so that the stress in the new (primed) system is
′ =
= −
⎛
⎝
⎜
⎞
⎠
⎟
⎛
⎝
⎜
⎞
⎠
⎟
−
⎛
⎝
⎜
⎞
⎠
⎟
σ
σ
θ
θ
θ
θ
σ
σ
θ
θ
θ
θ
ij
T
A A
cos
sin
sin
cos
cos
sin
sin
cos
1
2
0
0
=
+
−
−
+
⎛
⎝
⎜
⎞
⎠
⎟
cos
sin
(
) sin cos
(
) sin cos
sin
cos
.
σ
θ σ
θ σ
σ
θ
θ
σ
σ
θ
θ σ
θ σ
θ
1
2
2
2
2
1
2
1
1
2
2
2
(3)
The normal and shear stresses on the plane vary, depending
on the plane’s orientation. The normal stress component,
denoted by σ, is
σ = σ ′ 11 = σ 1 cos 2 θ + σ 2 sin 2 θ =
+
+
−
(
) (
) cos ,
σ
σ
σ
σ
θ
1
2
1
2
2
2
2
(4a)
and the shear component, denoted by τ, is
τ = σ ′
12 = (σ 2 − σ 1 ) sin θ cos θ =
−
(
) sin .
σ
σ
θ
2
1
2
2
(4b)
Figure 5.7-4 shows σ and τ as functions of θ for the case of
σ 1 and σ 2 negative ( |σ 1 | > |σ 2 |), which corresponds to compression at depth in the earth. A graphic way to show these
is with Mohr’s circle, a plot of σ versus τ (Fig. 5.7-5). Values
for all different planes lie on a circle centered at σ = (σ 1 + σ 2 )/2,
τ = 0, with radius (σ 2 − σ 1 )/2. The point on the circle with angle
2θ, measured clockwise from the −σ axis, gives the σ, τ values
on the plane whose normal is at angle θ to σ 1 . 1
Laboratory experiments on rocks under compression show
that fracture occurs when a critical combination of the absolute
value of shear stress and the normal stress is exceeded. This
relation, known as the Coulomb–Mohr failure criterion, can be
stated as
|τ | = τ o − nσ,
(5)
where τ o and n are properties of the material known as
the cohesive strength and coefficient of internal friction. (The
minus sign reflects the convention that compressional stresses
are negative.) The failure criterion plots as two lines in the
τ–σ plane, with τ axis intercepts ±τ o and slope ±n (Fig. 5.7-6).
If the principal stresses are σ 1 , σ 2 , such that Mohr’s circle does
not intersect the failure lines, the material does not fracture.
However, given the same σ 2 but a higher σ ′
1 , Mohr’s circle
intersects the line, and the material breaks.
The failure lines show how much shear stress, τ, can be
applied to a surface subject to a normal stress σ before failure
occurs. The cohesive strength is the minimum (absolute value)
shear stress for failure. The coefficient of internal friction indicates the additional shear stress sustainable as the normal stress
increases. Thus, deeper in the crust, where the pressure and
hence normal stress are higher, rocks are stronger, and higher
shear stress is required to break them.
The failure lines and Mohr’s circle show on which plane failure occurs for a given stress state. To find θ, the angle between
the plane’s normal and the maximum compressive stress (σ 1 )
direction, we write the failure lines as
|τ | = τ o − σ tan φ,
(6)
1 Following the seismological convention of compressive stresses being negative,
Mohr’s circle is shown for σ < 0. The opposite convention is often used in rock
mechanics, e.g. Figs. 5.7-3 and 5.7-10.
σ f
(a)
Stress,
σ
Fracture
Elastic
Strain, e
σ o
(b)
Stress,
σ
Elastic
Strain, e
Plastic
σ o
(c)
Stress,
σ
Strain, e
Plastic
σ o ′
Permanent
strain
Recoverable
elastic
strain
Fig. 5.7-1 (a): A material is perfectly elastic
until it fractures when the applied stress
reaches σ f . (b): A material undergoes plastic
deformation when the stress exceeds a yield
stress σ o . (c): A permanent strain results
from plastic deformation when the stress is
raised to σ ′ o and released.
Fig. 5.7-2 An elastic–perfectly plastic rheology, which is a commonly used
approximation for the behavior of ductile materials.
Stress,
σ
σ o
Perfectly plastic
Elastic
Strain, e
tensor from the principal axis coordinate system to a new coordinate system using the transformation matrix (Section 2.3.3)
A
cos
sin
sin
cos
= −
⎛
⎝
⎜
⎞
⎠
⎟
θ
θ
θ
θ
(2)
so that the stress in the new (primed) system is
′ =
= −
⎛
⎝
⎜
⎞
⎠
⎟
⎛
⎝
⎜
⎞
⎠
⎟
−
⎛
⎝
⎜
⎞
⎠
⎟
σ
σ
θ
θ
θ
θ
σ
σ
θ
θ
θ
θ
ij
T
A A
cos
sin
sin
cos
cos
sin
sin
cos
1
2
0
0
=
+
−
−
+
⎛
⎝
⎜
⎞
⎠
⎟
cos
sin
(
) sin cos
(
) sin cos
sin
cos
.
σ
θ σ
θ σ
σ
θ
θ
σ
σ
θ
θ σ
θ σ
θ
1
2
2
2
2
1
2
1
1
2
2
2
(3)
The normal and shear stresses on the plane vary, depending
on the plane’s orientation. The normal stress component,
denoted by σ, is
σ = σ ′ 11 = σ 1 cos 2 θ + σ 2 sin 2 θ =
+
+
−
(
) (
) cos ,
σ
σ
σ
σ
θ
1
2
1
2
2
2
2
(4a)
and the shear component, denoted by τ, is
τ = σ ′
12 = (σ 2 − σ 1 ) sin θ cos θ =
−
(
) sin .
σ
σ
θ
2
1
2
2
(4b)
Figure 5.7-4 shows σ and τ as functions of θ for the case of
σ 1 and σ 2 negative ( |σ 1 | > |σ 2 |), which corresponds to compression at depth in the earth. A graphic way to show these
is with Mohr’s circle, a plot of σ versus τ (Fig. 5.7-5). Values
for all different planes lie on a circle centered at σ = (σ 1 + σ 2 )/2,
τ = 0, with radius (σ 2 − σ 1 )/2. The point on the circle with angle
2θ, measured clockwise from the −σ axis, gives the σ, τ values
on the plane whose normal is at angle θ to σ 1 . 1
Laboratory experiments on rocks under compression show
that fracture occurs when a critical combination of the absolute
value of shear stress and the normal stress is exceeded. This
relation, known as the Coulomb–Mohr failure criterion, can be
stated as
|τ | = τ o − nσ,
(5)
where τ o and n are properties of the material known as
the cohesive strength and coefficient of internal friction. (The
minus sign reflects the convention that compressional stresses
are negative.) The failure criterion plots as two lines in the
τ–σ plane, with τ axis intercepts ±τ o and slope ±n (Fig. 5.7-6).
If the principal stresses are σ 1 , σ 2 , such that Mohr’s circle does
not intersect the failure lines, the material does not fracture.
However, given the same σ 2 but a higher σ ′
1 , Mohr’s circle
intersects the line, and the material breaks.
The failure lines show how much shear stress, τ, can be
applied to a surface subject to a normal stress σ before failure
occurs. The cohesive strength is the minimum (absolute value)
shear stress for failure. The coefficient of internal friction indicates the additional shear stress sustainable as the normal stress
increases. Thus, deeper in the crust, where the pressure and
hence normal stress are higher, rocks are stronger, and higher
shear stress is required to break them.
The failure lines and Mohr’s circle show on which plane failure occurs for a given stress state. To find θ, the angle between
the plane’s normal and the maximum compressive stress (σ 1 )
direction, we write the failure lines as
|τ | = τ o − σ tan φ,
(6)
1 Following the seismological convention of compressive stresses being negative,
Mohr’s circle is shown for σ < 0. The opposite convention is often used in rock
mechanics, e.g. Figs. 5.7-3 and 5.7-10.