

Kentucky
Tennessee
Regional
compressive
stress
Edge of
embayment
Michigan river system
(pre-glacial)
Outline
of buried
rift complex
Ancient
faults
Buried
rift
Upper crust
Earthquakes
Lower crust
Missouri
Arkansas
Illinois
Indiana
W
a b a s h
R .
O h io
R .
M
is s is s ip p i
R iv e r
R .
N
Ohio
5.7 Faulting and deformation in the earth 347
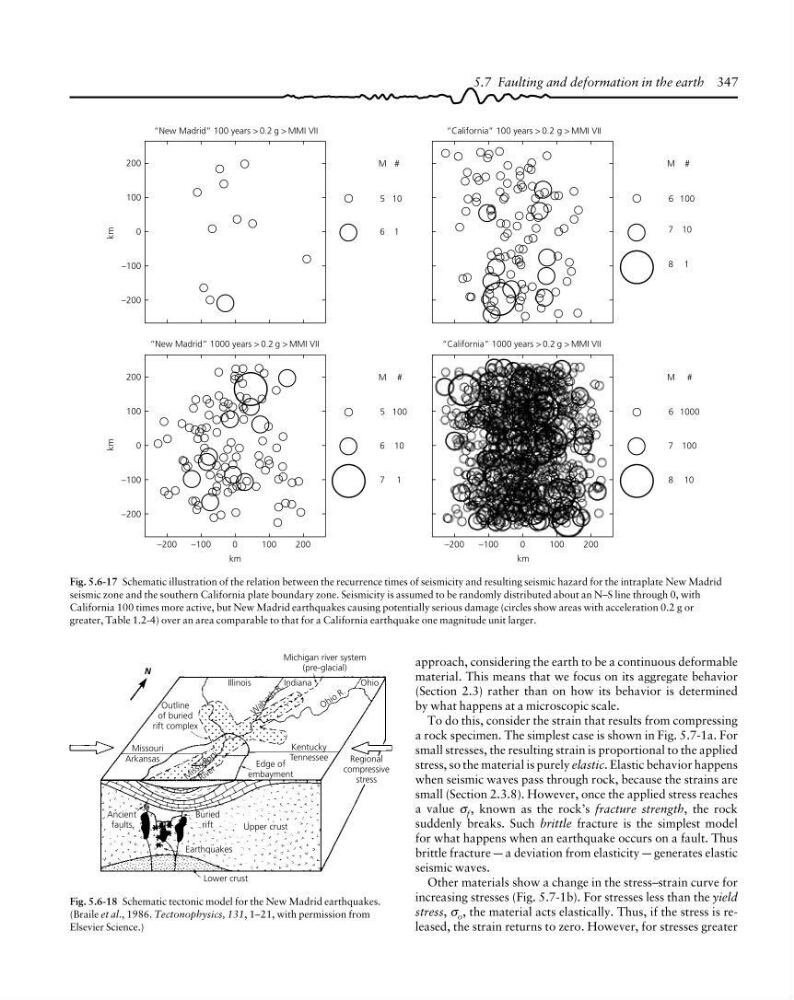
Fig. 5.6-18 Schematic tectonic model for the New Madrid earthquakes.
(Braile et al., 1986. Tectonophysics, 131, 1–21, with permission from
Elsevier Science.)
km
200
100
0
−100
−200
“New Madrid” 100 years > 0.2 g > MMI VII
M
5
6
km
200
100
0
−100
−200
“New Madrid” 1000 years > 0.2 g > MMI VII
M
5
6
−200
−100
0
100
200
km
7
“California” 1000 years > 0.2 g > MMI VII
M
6
7
−200
−100
0
100
200
km
8
“California” 100 years > 0.2 g > MMI VII
M
6
7
8
#
100
10
1
#
10
1
#
100
10
1
#
1000
100
10
Fig. 5.6-17 Schematic illustration of the relation between the recurrence times of seismicity and resulting seismic hazard for the intraplate New Madrid
seismic zone and the southern California plate boundary zone. Seismicity is assumed to be randomly distributed about an N–S line through 0, with
California 100 times more active, but New Madrid earthquakes causing potentially serious damage (circles show areas with acceleration 0.2 g or
greater, Table 1.2-4) over an area comparable to that for a California earthquake one magnitude unit larger.
approach, considering the earth to be a continuous deformable
material. This means that we focus on its aggregate behavior
(Section 2.3) rather than on how its behavior is determined
by what happens at a microscopic scale.
To do this, consider the strain that results from compressing
a rock specimen. The simplest case is shown in Fig. 5.7-1a. For
small stresses, the resulting strain is proportional to the applied
stress, so the material is purely elastic. Elastic behavior happens
when seismic waves pass through rock, because the strains are
small (Section 2.3.8). However, once the applied stress reaches
a value σ f , known as the rock’s fracture strength, the rock
suddenly breaks. Such brittle fracture is the simplest model
for what happens when an earthquake occurs on a fault. Thus
brittle fracture a a deviation from elasticity a generates elastic
seismic waves.
Other materials show a change in the stress–strain curve for
increasing stresses (Fig. 5.7-1b). For stresses less than the yield
stress, σ o , the material acts elastically. Thus, if the stress is released, the strain returns to zero. However, for stresses greater
Tennessee
Regional
compressive
stress
Edge of
embayment
Michigan river system
(pre-glacial)
Outline
of buried
rift complex
Ancient
faults
Buried
rift
Upper crust
Earthquakes
Lower crust
Missouri
Arkansas
Illinois
Indiana
W
a b a s h
R .
O h io
R .
M
is s is s ip p i
R iv e r
R .
N
Ohio
5.7 Faulting and deformation in the earth 347
Fig. 5.6-18 Schematic tectonic model for the New Madrid earthquakes.
(Braile et al., 1986. Tectonophysics, 131, 1–21, with permission from
Elsevier Science.)
km
200
100
0
−100
−200
“New Madrid” 100 years > 0.2 g > MMI VII
M
5
6
km
200
100
0
−100
−200
“New Madrid” 1000 years > 0.2 g > MMI VII
M
5
6
−200
−100
0
100
200
km
7
“California” 1000 years > 0.2 g > MMI VII
M
6
7
−200
−100
0
100
200
km
8
“California” 100 years > 0.2 g > MMI VII
M
6
7
8
#
100
10
1
#
10
1
#
100
10
1
#
1000
100
10
Fig. 5.6-17 Schematic illustration of the relation between the recurrence times of seismicity and resulting seismic hazard for the intraplate New Madrid
seismic zone and the southern California plate boundary zone. Seismicity is assumed to be randomly distributed about an N–S line through 0, with
California 100 times more active, but New Madrid earthquakes causing potentially serious damage (circles show areas with acceleration 0.2 g or
greater, Table 1.2-4) over an area comparable to that for a California earthquake one magnitude unit larger.
approach, considering the earth to be a continuous deformable
material. This means that we focus on its aggregate behavior
(Section 2.3) rather than on how its behavior is determined
by what happens at a microscopic scale.
To do this, consider the strain that results from compressing
a rock specimen. The simplest case is shown in Fig. 5.7-1a. For
small stresses, the resulting strain is proportional to the applied
stress, so the material is purely elastic. Elastic behavior happens
when seismic waves pass through rock, because the strains are
small (Section 2.3.8). However, once the applied stress reaches
a value σ f , known as the rock’s fracture strength, the rock
suddenly breaks. Such brittle fracture is the simplest model
for what happens when an earthquake occurs on a fault. Thus
brittle fracture a a deviation from elasticity a generates elastic
seismic waves.
Other materials show a change in the stress–strain curve for
increasing stresses (Fig. 5.7-1b). For stresses less than the yield
stress, σ o , the material acts elastically. Thus, if the stress is released, the strain returns to zero. However, for stresses greater