

Displacement rate (mm/yr)
80
70
60
50
40
30
20
10
0
−10
1200
Depth (km)
10
0
−10
−20
−30
−40
−50
−60
0
200
400
600
800
1000
1200
Distance from trench (km)
Trench
Altiplano
Fold-and-thrust belt
75
50
38
Surface trace of thrust faults
0
0
12
South segment
Coastal
Altiplano
FTB
0
200
400
600
800
1000
Distance from trench (km)
Normalized misfit
30
20
10
0
Shortening fold-and-thrust-belt
(mm/yr)
0
3 0
6 0
9 0
North segment
30
20
10
0
0
3 0
6 0
9 0
South segment
Slip rate locked on interplate thrust (mm/yr)
2
2
1.5
1
.
2
5
1 .5
1.2 5
1 .5
5
2
2
5.6 Continental earthquakes and tectonics 341
3 Strain rates are often written using a dot to indicate the time derivative.
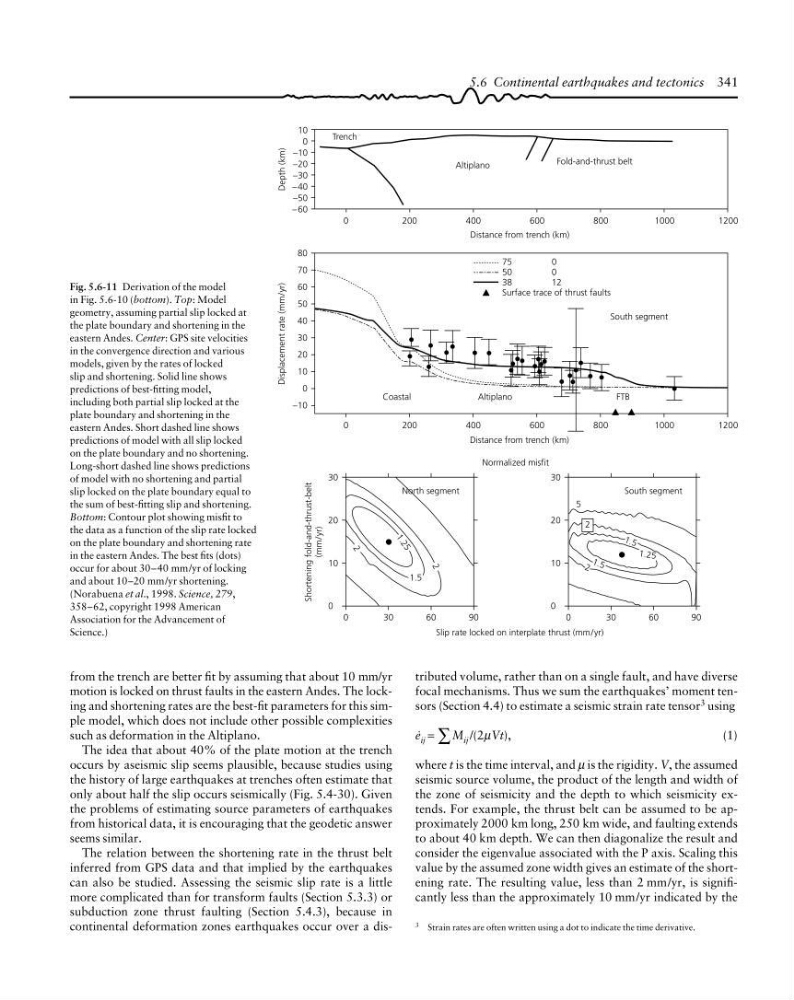
Fig. 5.6-11 Derivation of the model
in Fig. 5.6-10 (bottom). Top: Model
geometry, assuming partial slip locked at
the plate boundary and shortening in the
eastern Andes. Center: GPS site velocities
in the convergence direction and various
models, given by the rates of locked
slip and shortening. Solid line shows
predictions of best-fitting model,
including both partial slip locked at the
plate boundary and shortening in the
eastern Andes. Short dashed line shows
predictions of model with all slip locked
on the plate boundary and no shortening.
Long-short dashed line shows predictions
of model with no shortening and partial
slip locked on the plate boundary equal to
the sum of best-fitting slip and shortening.
Bottom: Contour plot showing misfit to
the data as a function of the slip rate locked
on the plate boundary and shortening rate
in the eastern Andes. The best fits (dots)
occur for about 30–40 mm/yr of locking
and about 10–20 mm/yr shortening.
(Norabuena et al., 1998. Science, 279,
358–62, copyright 1998 American
Association for the Advancement of
Science.)
from the trench are better fit by assuming that about 10 mm/yr
motion is locked on thrust faults in the eastern Andes. The locking and shortening rates are the best-fit parameters for this simple model, which does not include other possible complexities
such as deformation in the Altiplano.
The idea that about 40% of the plate motion at the trench
occurs by aseismic slip seems plausible, because studies using
the history of large earthquakes at trenches often estimate that
only about half the slip occurs seismically (Fig. 5.4-30). Given
the problems of estimating source parameters of earthquakes
from historical data, it is encouraging that the geodetic answer
seems similar.
The relation between the shortening rate in the thrust belt
inferred from GPS data and that implied by the earthquakes
can also be studied. Assessing the seismic slip rate is a little
more complicated than for transform faults (Section 5.3.3) or
subduction zone thrust faulting (Section 5.4.3), because in
continental deformation zones earthquakes occur over a distributed volume, rather than on a single fault, and have diverse
focal mechanisms. Thus we sum the earthquakes’ moment tensors (Section 4.4) to estimate a seismic strain rate tensor 3 using
G ij = ∑ M ij /(2µVt),
(1)
where t is the time interval, and µ is the rigidity. V, the assumed
seismic source volume, the product of the length and width of
the zone of seismicity and the depth to which seismicity extends. For example, the thrust belt can be assumed to be approximately 2000 km long, 250 km wide, and faulting extends
to about 40 km depth. We can then diagonalize the result and
consider the eigenvalue associated with the P axis. Scaling this
value by the assumed zone width gives an estimate of the shortening rate. The resulting value, less than 2 mm/yr, is significantly less than the approximately 10 mm/yr indicated by the
80
70
60
50
40
30
20
10
0
−10
1200
Depth (km)
10
0
−10
−20
−30
−40
−50
−60
0
200
400
600
800
1000
1200
Distance from trench (km)
Trench
Altiplano
Fold-and-thrust belt
75
50
38
Surface trace of thrust faults
0
0
12
South segment
Coastal
Altiplano
FTB
0
200
400
600
800
1000
Distance from trench (km)
Normalized misfit
30
20
10
0
Shortening fold-and-thrust-belt
(mm/yr)
0
3 0
6 0
9 0
North segment
30
20
10
0
0
3 0
6 0
9 0
South segment
Slip rate locked on interplate thrust (mm/yr)
2
2
1.5
1
.
2
5
1 .5
1.2 5
1 .5
5
2
2
5.6 Continental earthquakes and tectonics 341
3 Strain rates are often written using a dot to indicate the time derivative.
Fig. 5.6-11 Derivation of the model
in Fig. 5.6-10 (bottom). Top: Model
geometry, assuming partial slip locked at
the plate boundary and shortening in the
eastern Andes. Center: GPS site velocities
in the convergence direction and various
models, given by the rates of locked
slip and shortening. Solid line shows
predictions of best-fitting model,
including both partial slip locked at the
plate boundary and shortening in the
eastern Andes. Short dashed line shows
predictions of model with all slip locked
on the plate boundary and no shortening.
Long-short dashed line shows predictions
of model with no shortening and partial
slip locked on the plate boundary equal to
the sum of best-fitting slip and shortening.
Bottom: Contour plot showing misfit to
the data as a function of the slip rate locked
on the plate boundary and shortening rate
in the eastern Andes. The best fits (dots)
occur for about 30–40 mm/yr of locking
and about 10–20 mm/yr shortening.
(Norabuena et al., 1998. Science, 279,
358–62, copyright 1998 American
Association for the Advancement of
Science.)
from the trench are better fit by assuming that about 10 mm/yr
motion is locked on thrust faults in the eastern Andes. The locking and shortening rates are the best-fit parameters for this simple model, which does not include other possible complexities
such as deformation in the Altiplano.
The idea that about 40% of the plate motion at the trench
occurs by aseismic slip seems plausible, because studies using
the history of large earthquakes at trenches often estimate that
only about half the slip occurs seismically (Fig. 5.4-30). Given
the problems of estimating source parameters of earthquakes
from historical data, it is encouraging that the geodetic answer
seems similar.
The relation between the shortening rate in the thrust belt
inferred from GPS data and that implied by the earthquakes
can also be studied. Assessing the seismic slip rate is a little
more complicated than for transform faults (Section 5.3.3) or
subduction zone thrust faulting (Section 5.4.3), because in
continental deformation zones earthquakes occur over a distributed volume, rather than on a single fault, and have diverse
focal mechanisms. Thus we sum the earthquakes’ moment tensors (Section 4.4) to estimate a seismic strain rate tensor 3 using
G ij = ∑ M ij /(2µVt),
(1)
where t is the time interval, and µ is the rigidity. V, the assumed
seismic source volume, the product of the length and width of
the zone of seismicity and the depth to which seismicity extends. For example, the thrust belt can be assumed to be approximately 2000 km long, 250 km wide, and faulting extends
to about 40 km depth. We can then diagonalize the result and
consider the eigenvalue associated with the P axis. Scaling this
value by the assumed zone width gives an estimate of the shortening rate. The resulting value, less than 2 mm/yr, is significantly less than the approximately 10 mm/yr indicated by the