

340 Seismology and Plate Tectonics
−10°
300°
35 mm/yr locked
20 mm/yr stable sliding
Plate
motion
65 mm/yr net convergence
10 mm/yr
shortening
Tr en ch
N az ca p la te
Fo re a rc 5 − 1 0 m m /y r
A lt ip la n o
Fo re la n d
th ru st b e lt
S ta b le
S o u th A m e ri ca
290°
South
American
plate
Andes
F o r e l a n d t h r u s t b e l t
Nazca
plate
GPS Site
Motion
NUVEL-1A
77 mm/yr
−20°
Short wavelength
10
1,000,000
100,000
10,000
1000
100
Structural geology
Plate motions
Topography
Tectonic geomorphology
Paleoseismology
Seismology
Traditional
Space
Geodesy
Long wavelength
Earthquake
recurrence
Time (yr)
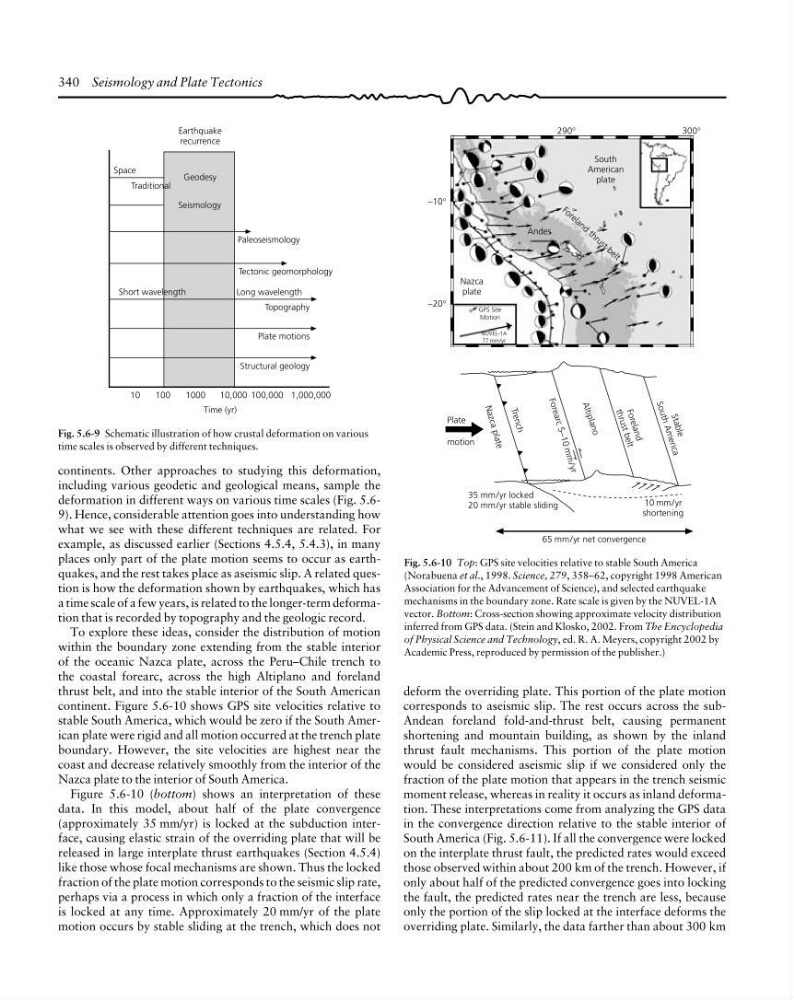
Fig. 5.6-9 Schematic illustration of how crustal deformation on various
time scales is observed by different techniques.
Fig. 5.6-10 Top: GPS site velocities relative to stable South America
(Norabuena et al., 1998. Science, 279, 358–62, copyright 1998 American
Association for the Advancement of Science), and selected earthquake
mechanisms in the boundary zone. Rate scale is given by the NUVEL-1A
vector. Bottom: Cross-section showing approximate velocity distribution
inferred from GPS data. (Stein and Klosko, 2002. From The Encyclopedia
of Physical Science and Technology, ed. R. A. Meyers, copyright 2002 by
Academic Press, reproduced by permission of the publisher.)
deform the overriding plate. This portion of the plate motion
corresponds to aseismic slip. The rest occurs across the subAndean foreland fold-and-thrust belt, causing permanent
shortening and mountain building, as shown by the inland
thrust fault mechanisms. This portion of the plate motion
would be considered aseismic slip if we considered only the
fraction of the plate motion that appears in the trench seismic
moment release, whereas in reality it occurs as inland deformation. These interpretations come from analyzing the GPS data
in the convergence direction relative to the stable interior of
South America (Fig. 5.6-11). If all the convergence were locked
on the interplate thrust fault, the predicted rates would exceed
those observed within about 200 km of the trench. However, if
only about half of the predicted convergence goes into locking
the fault, the predicted rates near the trench are less, because
only the portion of the slip locked at the interface deforms the
overriding plate. Similarly, the data farther than about 300 km
continents. Other approaches to studying this deformation,
including various geodetic and geological means, sample the
deformation in different ways on various time scales (Fig. 5.69). Hence, considerable attention goes into understanding how
what we see with these different techniques are related. For
example, as discussed earlier (Sections 4.5.4, 5.4.3), in many
places only part of the plate motion seems to occur as earthquakes, and the rest takes place as aseismic slip. A related question is how the deformation shown by earthquakes, which has
a time scale of a few years, is related to the longer-term deformation that is recorded by topography and the geologic record.
To explore these ideas, consider the distribution of motion
within the boundary zone extending from the stable interior
of the oceanic Nazca plate, across the Peru–Chile trench to
the coastal forearc, across the high Altiplano and foreland
thrust belt, and into the stable interior of the South American
continent. Figure 5.6-10 shows GPS site velocities relative to
stable South America, which would be zero if the South American plate were rigid and all motion occurred at the trench plate
boundary. However, the site velocities are highest near the
coast and decrease relatively smoothly from the interior of the
Nazca plate to the interior of South America.
Figure 5.6-10 (bottom) shows an interpretation of these
data. In this model, about half of the plate convergence
(approximately 35 mm/yr) is locked at the subduction interface, causing elastic strain of the overriding plate that will be
released in large interplate thrust earthquakes (Section 4.5.4)
like those whose focal mechanisms are shown. Thus the locked
fraction of the plate motion corresponds to the seismic slip rate,
perhaps via a process in which only a fraction of the interface
is locked at any time. Approximately 20 mm/yr of the plate
motion occurs by stable sliding at the trench, which does not
−10°
300°
35 mm/yr locked
20 mm/yr stable sliding
Plate
motion
65 mm/yr net convergence
10 mm/yr
shortening
Tr en ch
N az ca p la te
Fo re a rc 5 − 1 0 m m /y r
A lt ip la n o
Fo re la n d
th ru st b e lt
S ta b le
S o u th A m e ri ca
290°
South
American
plate
Andes
F o r e l a n d t h r u s t b e l t
Nazca
plate
GPS Site
Motion
NUVEL-1A
77 mm/yr
−20°
Short wavelength
10
1,000,000
100,000
10,000
1000
100
Structural geology
Plate motions
Topography
Tectonic geomorphology
Paleoseismology
Seismology
Traditional
Space
Geodesy
Long wavelength
Earthquake
recurrence
Time (yr)
Fig. 5.6-9 Schematic illustration of how crustal deformation on various
time scales is observed by different techniques.
Fig. 5.6-10 Top: GPS site velocities relative to stable South America
(Norabuena et al., 1998. Science, 279, 358–62, copyright 1998 American
Association for the Advancement of Science), and selected earthquake
mechanisms in the boundary zone. Rate scale is given by the NUVEL-1A
vector. Bottom: Cross-section showing approximate velocity distribution
inferred from GPS data. (Stein and Klosko, 2002. From The Encyclopedia
of Physical Science and Technology, ed. R. A. Meyers, copyright 2002 by
Academic Press, reproduced by permission of the publisher.)
deform the overriding plate. This portion of the plate motion
corresponds to aseismic slip. The rest occurs across the subAndean foreland fold-and-thrust belt, causing permanent
shortening and mountain building, as shown by the inland
thrust fault mechanisms. This portion of the plate motion
would be considered aseismic slip if we considered only the
fraction of the plate motion that appears in the trench seismic
moment release, whereas in reality it occurs as inland deformation. These interpretations come from analyzing the GPS data
in the convergence direction relative to the stable interior of
South America (Fig. 5.6-11). If all the convergence were locked
on the interplate thrust fault, the predicted rates would exceed
those observed within about 200 km of the trench. However, if
only about half of the predicted convergence goes into locking
the fault, the predicted rates near the trench are less, because
only the portion of the slip locked at the interface deforms the
overriding plate. Similarly, the data farther than about 300 km
continents. Other approaches to studying this deformation,
including various geodetic and geological means, sample the
deformation in different ways on various time scales (Fig. 5.69). Hence, considerable attention goes into understanding how
what we see with these different techniques are related. For
example, as discussed earlier (Sections 4.5.4, 5.4.3), in many
places only part of the plate motion seems to occur as earthquakes, and the rest takes place as aseismic slip. A related question is how the deformation shown by earthquakes, which has
a time scale of a few years, is related to the longer-term deformation that is recorded by topography and the geologic record.
To explore these ideas, consider the distribution of motion
within the boundary zone extending from the stable interior
of the oceanic Nazca plate, across the Peru–Chile trench to
the coastal forearc, across the high Altiplano and foreland
thrust belt, and into the stable interior of the South American
continent. Figure 5.6-10 shows GPS site velocities relative to
stable South America, which would be zero if the South American plate were rigid and all motion occurred at the trench plate
boundary. However, the site velocities are highest near the
coast and decrease relatively smoothly from the interior of the
Nazca plate to the interior of South America.
Figure 5.6-10 (bottom) shows an interpretation of these
data. In this model, about half of the plate convergence
(approximately 35 mm/yr) is locked at the subduction interface, causing elastic strain of the overriding plate that will be
released in large interplate thrust earthquakes (Section 4.5.4)
like those whose focal mechanisms are shown. Thus the locked
fraction of the plate motion corresponds to the seismic slip rate,
perhaps via a process in which only a fraction of the interface
is locked at any time. Approximately 20 mm/yr of the plate
motion occurs by stable sliding at the trench, which does not