

332 Seismology and Plate Tectonics
40°N
0°
40°S
50°E
160°W
100°E
150°E
2 kbar
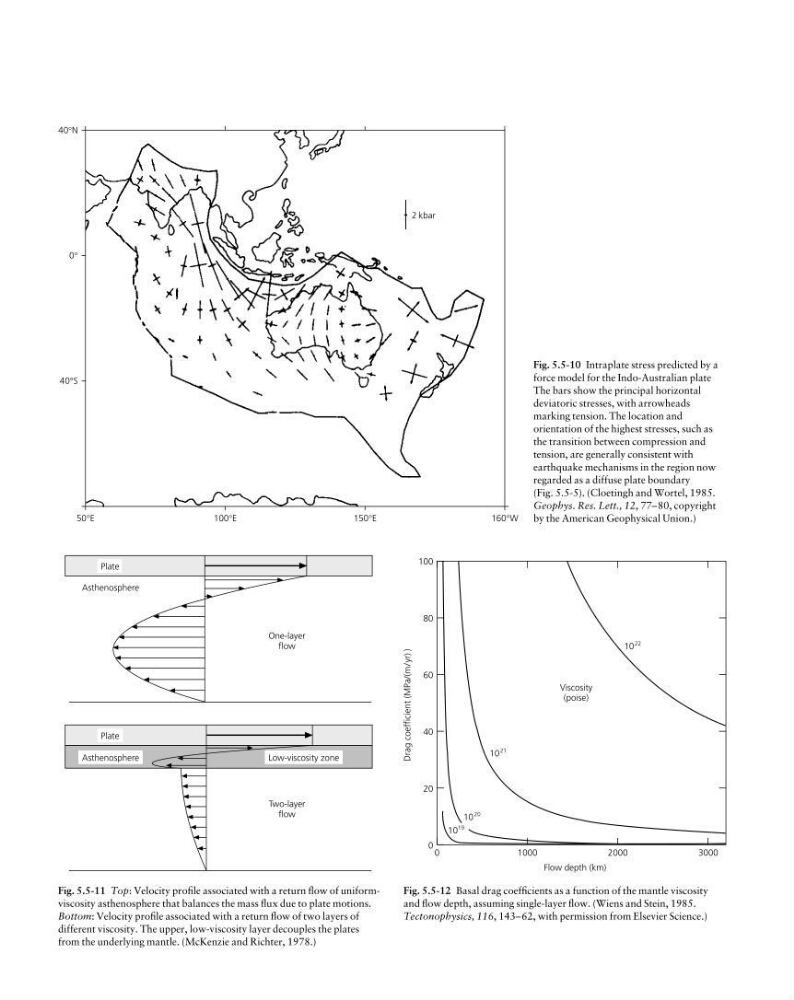
Fig. 5.5-10 Intraplate stress predicted by a
force model for the Indo-Australian plate
The bars show the principal horizontal
deviatoric stresses, with arrowheads
marking tension. The location and
orientation of the highest stresses, such as
the transition between compression and
tension, are generally consistent with
earthquake mechanisms in the region now
regarded as a diffuse plate boundary
(Fig. 5.5-5). (Cloetingh and Wortel, 1985.
Geophys. Res. Lett., 12, 77–80, copyright
by the American Geophysical Union.)
Plate
Asthenosphere
One-layer
flow
Plate
Asthenosphere
Low-viscosity zone
Two-layer
flow
Fig. 5.5-11 Top: Velocity profile associated with a return flow of uniformviscosity asthenosphere that balances the mass flux due to plate motions.
Bottom: Velocity profile associated with a return flow of two layers of
different viscosity. The upper, low-viscosity layer decouples the plates
from the underlying mantle. (McKenzie and Richter, 1978.)
Drag coefficient (MPa/(m/yr) )
100
80
60
40
20
0
0
1000
2000
3000
Flow depth (km)
10
22
Viscosity
(poise)
10
21
10
19
10
20
Fig. 5.5-12 Basal drag coefficients as a function of the mantle viscosity
and flow depth, assuming single-layer flow. (Wiens and Stein, 1985.
Tectonophysics, 116, 143–62, with permission from Elsevier Science.)
40°N
0°
40°S
50°E
160°W
100°E
150°E
2 kbar
Fig. 5.5-10 Intraplate stress predicted by a
force model for the Indo-Australian plate
The bars show the principal horizontal
deviatoric stresses, with arrowheads
marking tension. The location and
orientation of the highest stresses, such as
the transition between compression and
tension, are generally consistent with
earthquake mechanisms in the region now
regarded as a diffuse plate boundary
(Fig. 5.5-5). (Cloetingh and Wortel, 1985.
Geophys. Res. Lett., 12, 77–80, copyright
by the American Geophysical Union.)
Plate
Asthenosphere
One-layer
flow
Plate
Asthenosphere
Low-viscosity zone
Two-layer
flow
Fig. 5.5-11 Top: Velocity profile associated with a return flow of uniformviscosity asthenosphere that balances the mass flux due to plate motions.
Bottom: Velocity profile associated with a return flow of two layers of
different viscosity. The upper, low-viscosity layer decouples the plates
from the underlying mantle. (McKenzie and Richter, 1978.)
Drag coefficient (MPa/(m/yr) )
100
80
60
40
20
0
0
1000
2000
3000
Flow depth (km)
10
22
Viscosity
(poise)
10
21
10
19
10
20
Fig. 5.5-12 Basal drag coefficients as a function of the mantle viscosity
and flow depth, assuming single-layer flow. (Wiens and Stein, 1985.
Tectonophysics, 116, 143–62, with permission from Elsevier Science.)