

330 Seismology and Plate Tectonics
z
Basal drag stress
Ridge push force
F R (x)
b
m(x)
x
σ
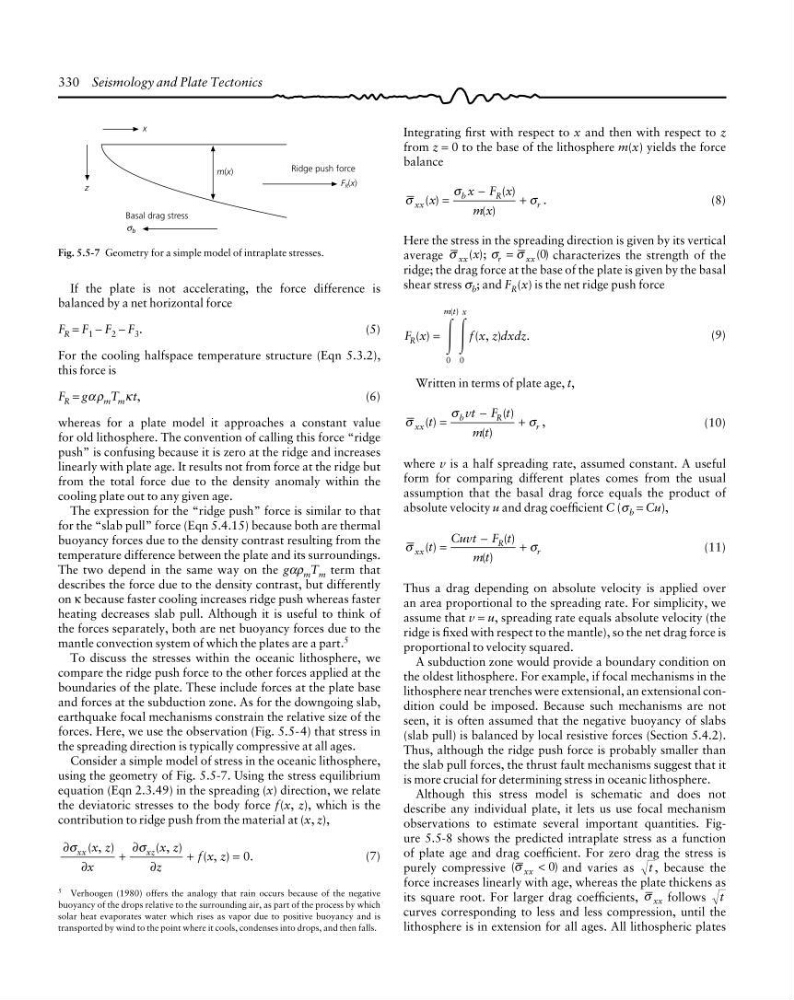
Fig. 5.5-7 Geometry for a simple model of intraplate stresses.
5 Verhoogen (1980) offers the analogy that rain occurs because of the negative
buoyancy of the drops relative to the surrounding air, as part of the process by which
solar heat evaporates water which rises as vapor due to positive buoyancy and is
transported by wind to the point where it cools, condenses into drops, and then falls.
If the plate is not accelerating, the force difference is
balanced by a net horizontal force
F R = F 1 − F 2 − F 3 .
(5)
For the cooling halfspace temperature structure (Eqn 5.3.2),
this force is
F R = gα ρ m T m κ t,
(6)
whereas for a plate model it approaches a constant value
for old lithosphere. The convention of calling this force “ridge
push” is confusing because it is zero at the ridge and increases
linearly with plate age. It results not from force at the ridge but
from the total force due to the density anomaly within the
cooling plate out to any given age.
The expression for the “ridge push” force is similar to that
for the “slab pull” force (Eqn 5.4.15) because both are thermal
buoyancy forces due to the density contrast resulting from the
temperature difference between the plate and its surroundings.
The two depend in the same way on the gαρ m T m term that
describes the force due to the density contrast, but differently
on κ because faster cooling increases ridge push whereas faster
heating decreases slab pull. Although it is useful to think of
the forces separately, both are net buoyancy forces due to the
mantle convection system of which the plates are a part. 5
To discuss the stresses within the oceanic lithosphere, we
compare the ridge push force to the other forces applied at the
boundaries of the plate. These include forces at the plate base
and forces at the subduction zone. As for the downgoing slab,
earthquake focal mechanisms constrain the relative size of the
forces. Here, we use the observation (Fig. 5.5-4) that stress in
the spreading direction is typically compressive at all ages.
Consider a simple model of stress in the oceanic lithosphere,
using the geometry of Fig. 5.5-7. Using the stress equilibrium
equation (Eqn 2.3.49) in the spreading (x) direction, we relate
the deviatoric stresses to the body force f(x, z), which is the
contribution to ridge push from the material at (x, z),
∂
∂
∂
∂
σ
σ
xx
xz
x z
x
x z
z
f x z
( , )
( , )
( , )
.
+
+
=0
(7)
Integrating first with respect to x and then with respect to z
from z = 0 to the base of the lithosphere m(x) yields the force
balance
σ
σ
σ
xx
b
R
r
x
x F x
m x
( )
( )
( )
.
=
−
+
(8)
Here the stress in the spreading direction is given by its vertical
average σ
σ σ
xx
r
xx
x
( );
( )
=
0 characterizes the strength of the
ridge; the drag force at the base of the plate is given by the basal
shear stress σ b ; and F R (x) is the net ridge push force
F x
f x z dxdz
R
m t x
( )
( , )
.
( )
=
Ύ Ύ
0 0
(9)
Written in terms of plate age, t,
σ
σ
σ
xx
b
R
r
t
vt F t
m t
( )
( )
( )
,
=
−
+
(10)
where v is a half spreading rate, assumed constant. A useful
form for comparing different plates comes from the usual
assumption that the basal drag force equals the product of
absolute velocity u and drag coefficient C (σ b = Cu),
σ
σ
xx
R
r
t
Cuvt F t
m t
( )
( )
( )
=
−
+
(11)
Thus a drag depending on absolute velocity is applied over
an area proportional to the spreading rate. For simplicity, we
assume that v = u, spreading rate equals absolute velocity (the
ridge is fixed with respect to the mantle), so the net drag force is
proportional to velocity squared.
A subduction zone would provide a boundary condition on
the oldest lithosphere. For example, if focal mechanisms in the
lithosphere near trenches were extensional, an extensional condition could be imposed. Because such mechanisms are not
seen, it is often assumed that the negative buoyancy of slabs
(slab pull) is balanced by local resistive forces (Section 5.4.2).
Thus, although the ridge push force is probably smaller than
the slab pull forces, the thrust fault mechanisms suggest that it
is more crucial for determining stress in oceanic lithosphere.
Although this stress model is schematic and does not
describe any individual plate, it lets us use focal mechanism
observations to estimate several important quantities. Figure 5.5-8 shows the predicted intraplate stress as a function
of plate age and drag coefficient. For zero drag the stress is
purely compressive (
)
σ xx < 0 and varies as t , because the
force increases linearly with age, whereas the plate thickens as
its square root. For larger drag coefficients, σ xx follows t
curves corresponding to less and less compression, until the
lithosphere is in extension for all ages. All lithospheric plates
z
Basal drag stress
Ridge push force
F R (x)
b
m(x)
x
σ
Fig. 5.5-7 Geometry for a simple model of intraplate stresses.
5 Verhoogen (1980) offers the analogy that rain occurs because of the negative
buoyancy of the drops relative to the surrounding air, as part of the process by which
solar heat evaporates water which rises as vapor due to positive buoyancy and is
transported by wind to the point where it cools, condenses into drops, and then falls.
If the plate is not accelerating, the force difference is
balanced by a net horizontal force
F R = F 1 − F 2 − F 3 .
(5)
For the cooling halfspace temperature structure (Eqn 5.3.2),
this force is
F R = gα ρ m T m κ t,
(6)
whereas for a plate model it approaches a constant value
for old lithosphere. The convention of calling this force “ridge
push” is confusing because it is zero at the ridge and increases
linearly with plate age. It results not from force at the ridge but
from the total force due to the density anomaly within the
cooling plate out to any given age.
The expression for the “ridge push” force is similar to that
for the “slab pull” force (Eqn 5.4.15) because both are thermal
buoyancy forces due to the density contrast resulting from the
temperature difference between the plate and its surroundings.
The two depend in the same way on the gαρ m T m term that
describes the force due to the density contrast, but differently
on κ because faster cooling increases ridge push whereas faster
heating decreases slab pull. Although it is useful to think of
the forces separately, both are net buoyancy forces due to the
mantle convection system of which the plates are a part. 5
To discuss the stresses within the oceanic lithosphere, we
compare the ridge push force to the other forces applied at the
boundaries of the plate. These include forces at the plate base
and forces at the subduction zone. As for the downgoing slab,
earthquake focal mechanisms constrain the relative size of the
forces. Here, we use the observation (Fig. 5.5-4) that stress in
the spreading direction is typically compressive at all ages.
Consider a simple model of stress in the oceanic lithosphere,
using the geometry of Fig. 5.5-7. Using the stress equilibrium
equation (Eqn 2.3.49) in the spreading (x) direction, we relate
the deviatoric stresses to the body force f(x, z), which is the
contribution to ridge push from the material at (x, z),
∂
∂
∂
∂
σ
σ
xx
xz
x z
x
x z
z
f x z
( , )
( , )
( , )
.
+
+
=0
(7)
Integrating first with respect to x and then with respect to z
from z = 0 to the base of the lithosphere m(x) yields the force
balance
σ
σ
σ
xx
b
R
r
x
x F x
m x
( )
( )
( )
.
=
−
+
(8)
Here the stress in the spreading direction is given by its vertical
average σ
σ σ
xx
r
xx
x
( );
( )
=
0 characterizes the strength of the
ridge; the drag force at the base of the plate is given by the basal
shear stress σ b ; and F R (x) is the net ridge push force
F x
f x z dxdz
R
m t x
( )
( , )
.
( )
=
Ύ Ύ
0 0
(9)
Written in terms of plate age, t,
σ
σ
σ
xx
b
R
r
t
vt F t
m t
( )
( )
( )
,
=
−
+
(10)
where v is a half spreading rate, assumed constant. A useful
form for comparing different plates comes from the usual
assumption that the basal drag force equals the product of
absolute velocity u and drag coefficient C (σ b = Cu),
σ
σ
xx
R
r
t
Cuvt F t
m t
( )
( )
( )
=
−
+
(11)
Thus a drag depending on absolute velocity is applied over
an area proportional to the spreading rate. For simplicity, we
assume that v = u, spreading rate equals absolute velocity (the
ridge is fixed with respect to the mantle), so the net drag force is
proportional to velocity squared.
A subduction zone would provide a boundary condition on
the oldest lithosphere. For example, if focal mechanisms in the
lithosphere near trenches were extensional, an extensional condition could be imposed. Because such mechanisms are not
seen, it is often assumed that the negative buoyancy of slabs
(slab pull) is balanced by local resistive forces (Section 5.4.2).
Thus, although the ridge push force is probably smaller than
the slab pull forces, the thrust fault mechanisms suggest that it
is more crucial for determining stress in oceanic lithosphere.
Although this stress model is schematic and does not
describe any individual plate, it lets us use focal mechanism
observations to estimate several important quantities. Figure 5.5-8 shows the predicted intraplate stress as a function
of plate age and drag coefficient. For zero drag the stress is
purely compressive (
)
σ xx < 0 and varies as t , because the
force increases linearly with age, whereas the plate thickens as
its square root. For larger drag coefficients, σ xx follows t
curves corresponding to less and less compression, until the
lithosphere is in extension for all ages. All lithospheric plates