

320 Seismology and Plate Tectonics
mantle flow. The simplest explanation for the cessation of deep
seismicity is that slabs cannot penetrate the lower mantle.
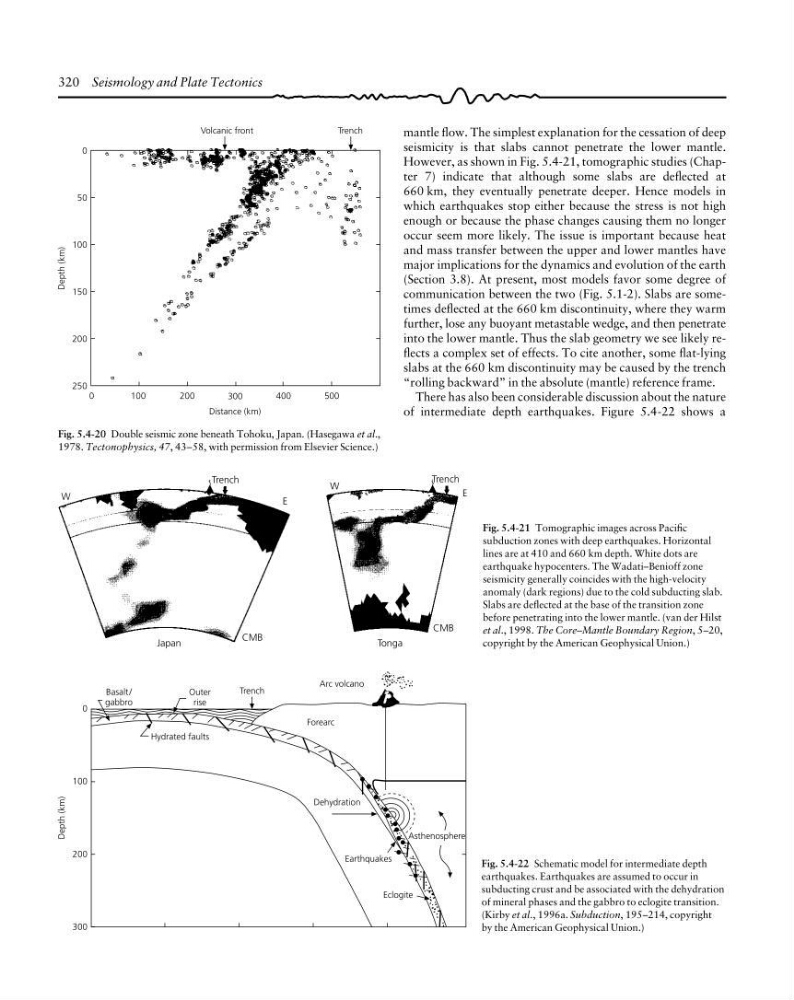
However, as shown in Fig. 5.4-21, tomographic studies (Chapter 7) indicate that although some slabs are deflected at
660 km, they eventually penetrate deeper. Hence models in
which earthquakes stop either because the stress is not high
enough or because the phase changes causing them no longer
occur seem more likely. The issue is important because heat
and mass transfer between the upper and lower mantles have
major implications for the dynamics and evolution of the earth
(Section 3.8). At present, most models favor some degree of
communication between the two (Fig. 5.1-2). Slabs are sometimes deflected at the 660 km discontinuity, where they warm
further, lose any buoyant metastable wedge, and then penetrate
into the lower mantle. Thus the slab geometry we see likely reflects a complex set of effects. To cite another, some flat-lying
slabs at the 660 km discontinuity may be caused by the trench
“rolling backward” in the absolute (mantle) reference frame.
There has also been considerable discussion about the nature
of intermediate depth earthquakes. Figure 5.4-22 shows a
Depth (km)
0
100
200
300
Dehydration
Hydrated faults
Basalt/
gabbro
Outer
rise
Trench
Forearc
Arc volcano
Earthquakes
Asthenosphere
Eclogite
Fig. 5.4-22 Schematic model for intermediate depth
earthquakes. Earthquakes are assumed to occur in
subducting crust and be associated with the dehydration
of mineral phases and the gabbro to eclogite transition.
(Kirby et al., 1996a. Subduction, 195–214, copyright
by the American Geophysical Union.)
W
E
CMB
Japan
Tonga
Trench
Trench
E
W
CMB
Fig. 5.4-21 Tomographic images across Pacific
subduction zones with deep earthquakes. Horizontal
lines are at 410 and 660 km depth. White dots are
earthquake hypocenters. The Wadati–Benioff zone
seismicity generally coincides with the high-velocity
anomaly (dark regions) due to the cold subducting slab.
Slabs are deflected at the base of the transition zone
before penetrating into the lower mantle. (van der Hilst
et al., 1998. The Core–Mantle Boundary Region, 5–20,
copyright by the American Geophysical Union.)
Depth (km)
0
50
100
150
200
250
0
100
200
300
400
500
Volcanic front
Trench
Distance (km)
Fig. 5.4-20 Double seismic zone beneath Tohoku, Japan. (Hasegawa et al.,
1978. Tectonophysics, 47, 43–58, with permission from Elsevier Science.)
mantle flow. The simplest explanation for the cessation of deep
seismicity is that slabs cannot penetrate the lower mantle.
However, as shown in Fig. 5.4-21, tomographic studies (Chapter 7) indicate that although some slabs are deflected at
660 km, they eventually penetrate deeper. Hence models in
which earthquakes stop either because the stress is not high
enough or because the phase changes causing them no longer
occur seem more likely. The issue is important because heat
and mass transfer between the upper and lower mantles have
major implications for the dynamics and evolution of the earth
(Section 3.8). At present, most models favor some degree of
communication between the two (Fig. 5.1-2). Slabs are sometimes deflected at the 660 km discontinuity, where they warm
further, lose any buoyant metastable wedge, and then penetrate
into the lower mantle. Thus the slab geometry we see likely reflects a complex set of effects. To cite another, some flat-lying
slabs at the 660 km discontinuity may be caused by the trench
“rolling backward” in the absolute (mantle) reference frame.
There has also been considerable discussion about the nature
of intermediate depth earthquakes. Figure 5.4-22 shows a
Depth (km)
0
100
200
300
Dehydration
Hydrated faults
Basalt/
gabbro
Outer
rise
Trench
Forearc
Arc volcano
Earthquakes
Asthenosphere
Eclogite
Fig. 5.4-22 Schematic model for intermediate depth
earthquakes. Earthquakes are assumed to occur in
subducting crust and be associated with the dehydration
of mineral phases and the gabbro to eclogite transition.
(Kirby et al., 1996a. Subduction, 195–214, copyright
by the American Geophysical Union.)
W
E
CMB
Japan
Tonga
Trench
Trench
E
W
CMB
Fig. 5.4-21 Tomographic images across Pacific
subduction zones with deep earthquakes. Horizontal
lines are at 410 and 660 km depth. White dots are
earthquake hypocenters. The Wadati–Benioff zone
seismicity generally coincides with the high-velocity
anomaly (dark regions) due to the cold subducting slab.
Slabs are deflected at the base of the transition zone
before penetrating into the lower mantle. (van der Hilst
et al., 1998. The Core–Mantle Boundary Region, 5–20,
copyright by the American Geophysical Union.)
Depth (km)
0
50
100
150
200
250
0
100
200
300
400
500
Volcanic front
Trench
Distance (km)
Fig. 5.4-20 Double seismic zone beneath Tohoku, Japan. (Hasegawa et al.,
1978. Tectonophysics, 47, 43–58, with permission from Elsevier Science.)