

Temperature (°C)
2400
2000
1600
1200
800
Liquid
8
1 2
1 6
2 0
2 4
2 8
Pressure (GPa)
Up we llin g
Am bie nt
Do wn we llin g
pv + mw
α
β
γ
5.4 Subduction zones 315
Fig. 5.4-12 The absolute velocity of lithospheric plates increases with the
fraction of the plate’s boundary formed by subducting slabs, suggesting
that slabs provide a major driving force for plate motions. (Forsyth and
Uyeda, 1975.)
Percent of circumference
connected to descending slab
30
20
10
0
Eurasian
North American
South American
Antarctic
African
Caribbean
Arabian
Indian
Nazca
Pacific
Cocos
0
5
10
Philippine
Velocity (cm/yr)
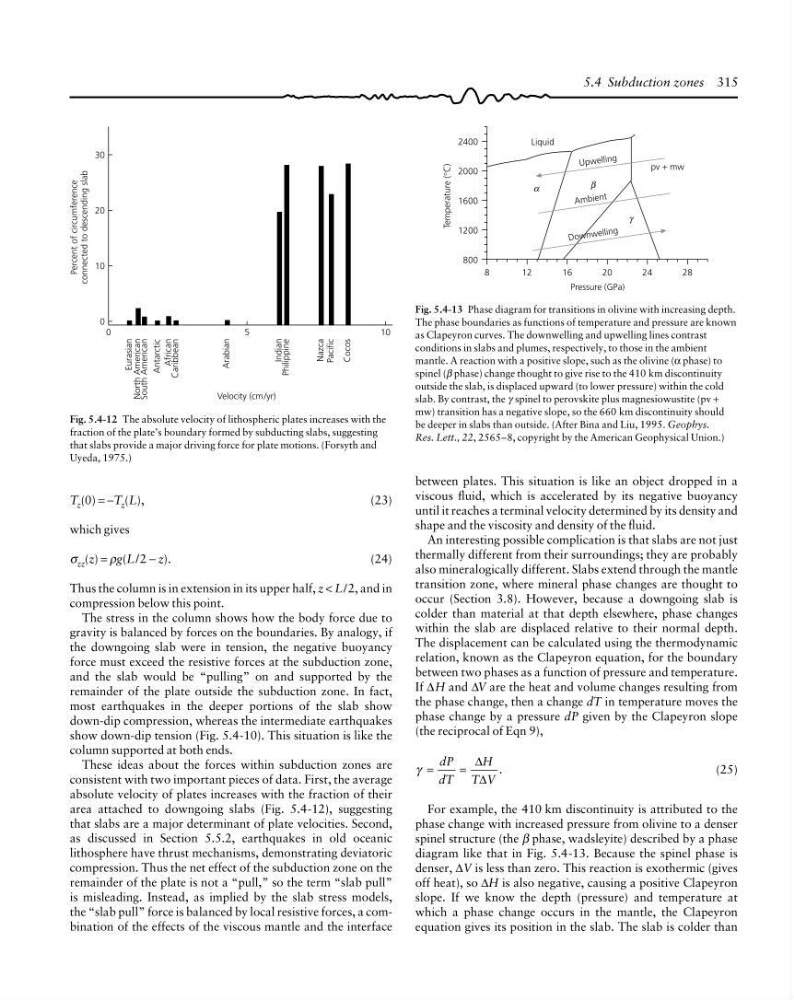
Fig. 5.4-13 Phase diagram for transitions in olivine with increasing depth.
The phase boundaries as functions of temperature and pressure are known
as Clapeyron curves. The downwelling and upwelling lines contrast
conditions in slabs and plumes, respectively, to those in the ambient
mantle. A reaction with a positive slope, such as the olivine (α phase) to
spinel (β phase) change thought to give rise to the 410 km discontinuity
outside the slab, is displaced upward (to lower pressure) within the cold
slab. By contrast, the γ spinel to perovskite plus magnesiowustite (pv +
mw) transition has a negative slope, so the 660 km discontinuity should
be deeper in slabs than outside. (After Bina and Liu, 1995. Geophys.
Res. Lett., 22, 2565–8, copyright by the American Geophysical Union.)
T z (0) = −T z (L),
(23)
which gives
σ zz (z) = ρg(L/2 − z).
(24)
Thus the column is in extension in its upper half, z < L/2, and in
compression below this point.
The stress in the column shows how the body force due to
gravity is balanced by forces on the boundaries. By analogy, if
the downgoing slab were in tension, the negative buoyancy
force must exceed the resistive forces at the subduction zone,
and the slab would be “pulling” on and supported by the
remainder of the plate outside the subduction zone. In fact,
most earthquakes in the deeper portions of the slab show
down-dip compression, whereas the intermediate earthquakes
show down-dip tension (Fig. 5.4-10). This situation is like the
column supported at both ends.
These ideas about the forces within subduction zones are
consistent with two important pieces of data. First, the average
absolute velocity of plates increases with the fraction of their
area attached to downgoing slabs (Fig. 5.4-12), suggesting
that slabs are a major determinant of plate velocities. Second,
as discussed in Section 5.5.2, earthquakes in old oceanic
lithosphere have thrust mechanisms, demonstrating deviatoric
compression. Thus the net effect of the subduction zone on the
remainder of the plate is not a “pull,” so the term “slab pull”
is misleading. Instead, as implied by the slab stress models,
the “slab pull” force is balanced by local resistive forces, a combination of the effects of the viscous mantle and the interface
between plates. This situation is like an object dropped in a
viscous fluid, which is accelerated by its negative buoyancy
until it reaches a terminal velocity determined by its density and
shape and the viscosity and density of the fluid.
An interesting possible complication is that slabs are not just
thermally different from their surroundings; they are probably
also mineralogically different. Slabs extend through the mantle
transition zone, where mineral phase changes are thought to
occur (Section 3.8). However, because a downgoing slab is
colder than material at that depth elsewhere, phase changes
within the slab are displaced relative to their normal depth.
The displacement can be calculated using the thermodynamic
relation, known as the Clapeyron equation, for the boundary
between two phases as a function of pressure and temperature.
If ∆H and ∆V are the heat and volume changes resulting from
the phase change, then a change dT in temperature moves the
phase change by a pressure dP given by the Clapeyron slope
(the reciprocal of Eqn 9),
γ
.
=
=
dP
dT
H
T V
∆
∆
(25)
For example, the 410 km discontinuity is attributed to the
phase change with increased pressure from olivine to a denser
spinel structure (the β phase, wadsleyite) described by a phase
diagram like that in Fig. 5.4-13. Because the spinel phase is
denser, ∆V is less than zero. This reaction is exothermic (gives
off heat), so ∆H is also negative, causing a positive Clapeyron
slope. If we know the depth (pressure) and temperature at
which a phase change occurs in the mantle, the Clapeyron
equation gives its position in the slab. The slab is colder than
2400
2000
1600
1200
800
Liquid
8
1 2
1 6
2 0
2 4
2 8
Pressure (GPa)
Up we llin g
Am bie nt
Do wn we llin g
pv + mw
α
β
γ
5.4 Subduction zones 315
Fig. 5.4-12 The absolute velocity of lithospheric plates increases with the
fraction of the plate’s boundary formed by subducting slabs, suggesting
that slabs provide a major driving force for plate motions. (Forsyth and
Uyeda, 1975.)
Percent of circumference
connected to descending slab
30
20
10
0
Eurasian
North American
South American
Antarctic
African
Caribbean
Arabian
Indian
Nazca
Pacific
Cocos
0
5
10
Philippine
Velocity (cm/yr)
Fig. 5.4-13 Phase diagram for transitions in olivine with increasing depth.
The phase boundaries as functions of temperature and pressure are known
as Clapeyron curves. The downwelling and upwelling lines contrast
conditions in slabs and plumes, respectively, to those in the ambient
mantle. A reaction with a positive slope, such as the olivine (α phase) to
spinel (β phase) change thought to give rise to the 410 km discontinuity
outside the slab, is displaced upward (to lower pressure) within the cold
slab. By contrast, the γ spinel to perovskite plus magnesiowustite (pv +
mw) transition has a negative slope, so the 660 km discontinuity should
be deeper in slabs than outside. (After Bina and Liu, 1995. Geophys.
Res. Lett., 22, 2565–8, copyright by the American Geophysical Union.)
T z (0) = −T z (L),
(23)
which gives
σ zz (z) = ρg(L/2 − z).
(24)
Thus the column is in extension in its upper half, z < L/2, and in
compression below this point.
The stress in the column shows how the body force due to
gravity is balanced by forces on the boundaries. By analogy, if
the downgoing slab were in tension, the negative buoyancy
force must exceed the resistive forces at the subduction zone,
and the slab would be “pulling” on and supported by the
remainder of the plate outside the subduction zone. In fact,
most earthquakes in the deeper portions of the slab show
down-dip compression, whereas the intermediate earthquakes
show down-dip tension (Fig. 5.4-10). This situation is like the
column supported at both ends.
These ideas about the forces within subduction zones are
consistent with two important pieces of data. First, the average
absolute velocity of plates increases with the fraction of their
area attached to downgoing slabs (Fig. 5.4-12), suggesting
that slabs are a major determinant of plate velocities. Second,
as discussed in Section 5.5.2, earthquakes in old oceanic
lithosphere have thrust mechanisms, demonstrating deviatoric
compression. Thus the net effect of the subduction zone on the
remainder of the plate is not a “pull,” so the term “slab pull”
is misleading. Instead, as implied by the slab stress models,
the “slab pull” force is balanced by local resistive forces, a combination of the effects of the viscous mantle and the interface
between plates. This situation is like an object dropped in a
viscous fluid, which is accelerated by its negative buoyancy
until it reaches a terminal velocity determined by its density and
shape and the viscosity and density of the fluid.
An interesting possible complication is that slabs are not just
thermally different from their surroundings; they are probably
also mineralogically different. Slabs extend through the mantle
transition zone, where mineral phase changes are thought to
occur (Section 3.8). However, because a downgoing slab is
colder than material at that depth elsewhere, phase changes
within the slab are displaced relative to their normal depth.
The displacement can be calculated using the thermodynamic
relation, known as the Clapeyron equation, for the boundary
between two phases as a function of pressure and temperature.
If ∆H and ∆V are the heat and volume changes resulting from
the phase change, then a change dT in temperature moves the
phase change by a pressure dP given by the Clapeyron slope
(the reciprocal of Eqn 9),
γ
.
=
=
dP
dT
H
T V
∆
∆
(25)
For example, the 410 km discontinuity is attributed to the
phase change with increased pressure from olivine to a denser
spinel structure (the β phase, wadsleyite) described by a phase
diagram like that in Fig. 5.4-13. Because the spinel phase is
denser, ∆V is less than zero. This reaction is exothermic (gives
off heat), so ∆H is also negative, causing a positive Clapeyron
slope. If we know the depth (pressure) and temperature at
which a phase change occurs in the mantle, the Clapeyron
equation gives its position in the slab. The slab is colder than