

Log number of earthquakes
5.0
4.5
4.0
3.5
3.0
2.5
2.0
1.5
1.0
0.5
0
100
0
200
300
400
500
600
700
Depth (km)
Global seismicity versus depth
(1964–98)
m b ≥4
m b ≥5
m b ≥6
Fiji
Hi gh Q
Tonga Trench
Se ism ic
z o n e
H ig h
Q
Hig h Q
Low Q
Rar oto nga
Lo w Q
Hi gh Q
High Q
Hi gh Q
0
200 km
km
100
200
300
400
500
600
700
Low
Q
path
High
Q
path
VUN
180°
NIU
175°W
Trench
Low Q path
High Q path
10 s
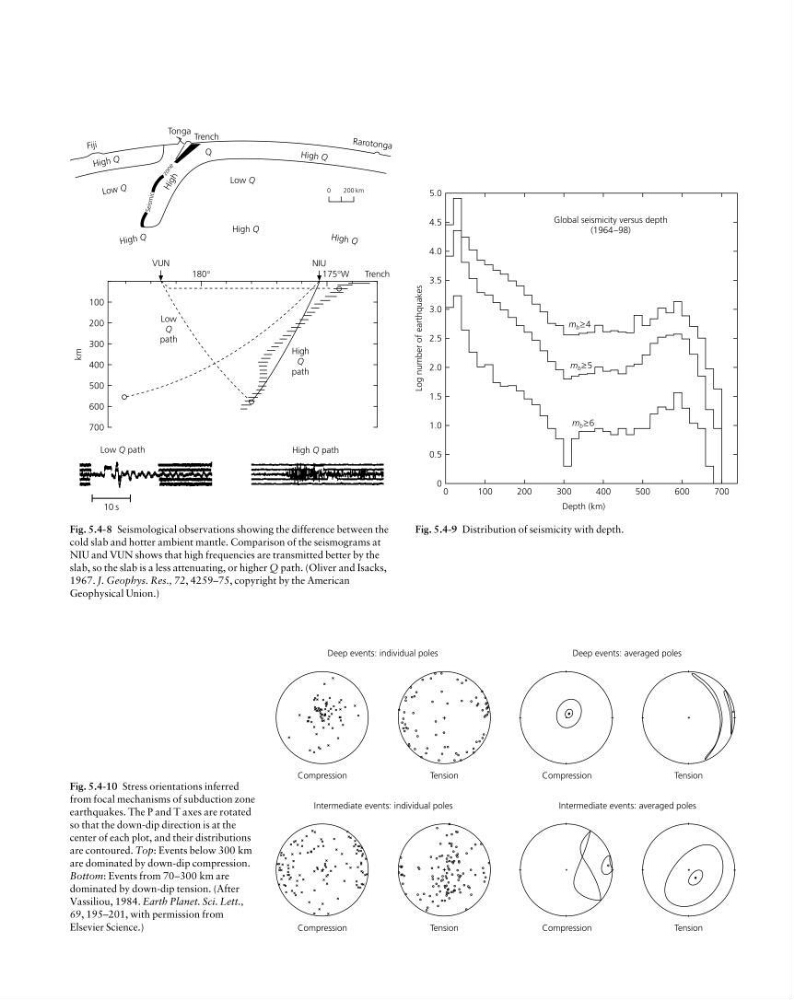
Fig. 5.4-8 Seismological observations showing the difference between the
cold slab and hotter ambient mantle. Comparison of the seismograms at
NIU and VUN shows that high frequencies are transmitted better by the
slab, so the slab is a less attenuating, or higher Q path. (Oliver and Isacks,
1967. J. Geophys. Res., 72, 4259–75, copyright by the American
Geophysical Union.)
Subduction zones 313
Fig. 5.4-10 Stress orientations inferred
from focal mechanisms of subduction zone
earthquakes. The P and T axes are rotated
so that the down-dip direction is at the
center of each plot, and their distributions
are contoured. Top: Events below 300 km
are dominated by down-dip compression.
Bottom: Events from 70–300 km are
dominated by down-dip tension. (After
Vassiliou, 1984. Earth Planet. Sci. Lett.,
69, 195–201, with permission from
Elsevier Science.)
Compression
Deep events: individual poles
Deep events: averaged poles
Tension
Compression
Tension
Intermediate events: individual poles
Intermediate events: averaged poles
Compression
Tension
Compression
Tension
Fig. 5.4-9 Distribution of seismicity with depth.
5.0
4.5
4.0
3.5
3.0
2.5
2.0
1.5
1.0
0.5
0
100
0
200
300
400
500
600
700
Depth (km)
Global seismicity versus depth
(1964–98)
m b ≥4
m b ≥5
m b ≥6
Fiji
Hi gh Q
Tonga Trench
Se ism ic
z o n e
H ig h
Q
Hig h Q
Low Q
Rar oto nga
Lo w Q
Hi gh Q
High Q
Hi gh Q
0
200 km
km
100
200
300
400
500
600
700
Low
Q
path
High
Q
path
VUN
180°
NIU
175°W
Trench
Low Q path
High Q path
10 s
Fig. 5.4-8 Seismological observations showing the difference between the
cold slab and hotter ambient mantle. Comparison of the seismograms at
NIU and VUN shows that high frequencies are transmitted better by the
slab, so the slab is a less attenuating, or higher Q path. (Oliver and Isacks,
1967. J. Geophys. Res., 72, 4259–75, copyright by the American
Geophysical Union.)
Subduction zones 313
Fig. 5.4-10 Stress orientations inferred
from focal mechanisms of subduction zone
earthquakes. The P and T axes are rotated
so that the down-dip direction is at the
center of each plot, and their distributions
are contoured. Top: Events below 300 km
are dominated by down-dip compression.
Bottom: Events from 70–300 km are
dominated by down-dip tension. (After
Vassiliou, 1984. Earth Planet. Sci. Lett.,
69, 195–201, with permission from
Elsevier Science.)
Compression
Deep events: individual poles
Deep events: averaged poles
Tension
Compression
Tension
Intermediate events: individual poles
Intermediate events: averaged poles
Compression
Tension
Compression
Tension
Fig. 5.4-9 Distribution of seismicity with depth.