

312 Seismology and Plate Tectonics
200
400
600
800
1000
1200
1400
ISC delay time inversion
Depth (km)
Image of upper mantle slab model
200
400
600
800
1000
1200
1400
Depth (km)
Exact upper mantle slab model
Cell hit count (10-logarithmic contouring)
0
1000 km
2000
2000
1000 km
0
3.5
0
+3%
−3%
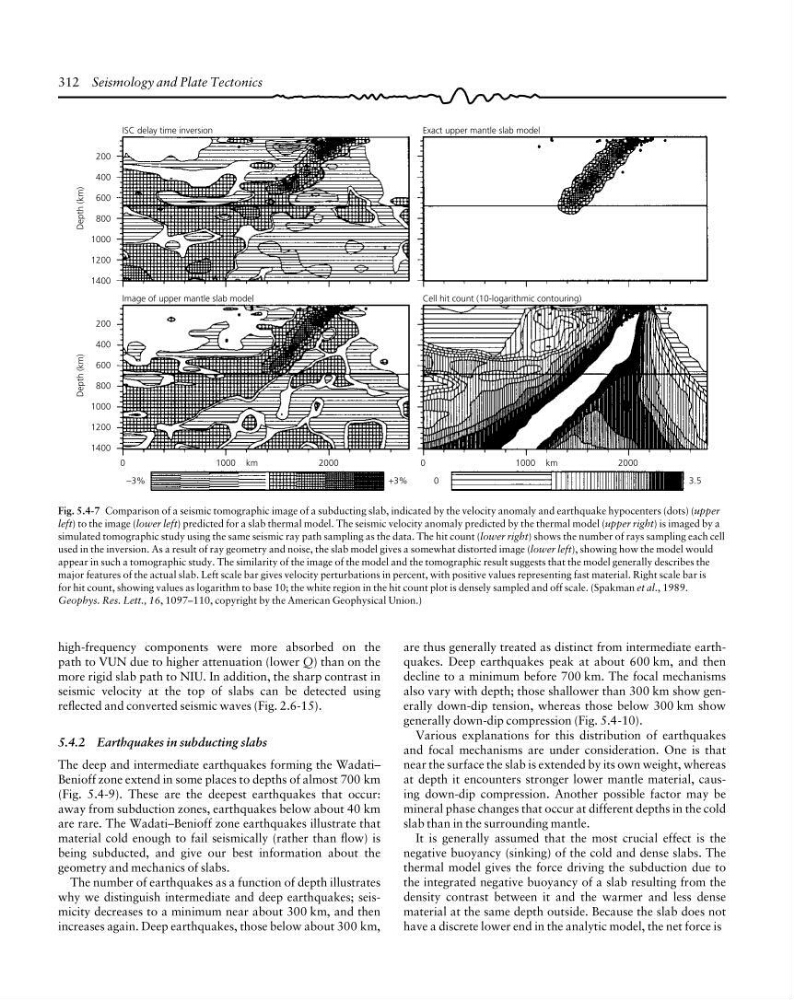
Fig. 5.4-7 Comparison of a seismic tomographic image of a subducting slab, indicated by the velocity anomaly and earthquake hypocenters (dots) (upper
left) to the image (lower left) predicted for a slab thermal model. The seismic velocity anomaly predicted by the thermal model (upper right) is imaged by a
simulated tomographic study using the same seismic ray path sampling as the data. The hit count (lower right) shows the number of rays sampling each cell
used in the inversion. As a result of ray geometry and noise, the slab model gives a somewhat distorted image (lower left), showing how the model would
appear in such a tomographic study. The similarity of the image of the model and the tomographic result suggests that the model generally describes the
major features of the actual slab. Left scale bar gives velocity perturbations in percent, with positive values representing fast material. Right scale bar is
for hit count, showing values as logarithm to base 10; the white region in the hit count plot is densely sampled and off scale. (Spakman et al., 1989.
Geophys. Res. Lett., 16, 1097–110, copyright by the American Geophysical Union.)
high-frequency components were more absorbed on the
path to VUN due to higher attenuation (lower Q) than on the
more rigid slab path to NIU. In addition, the sharp contrast in
seismic velocity at the top of slabs can be detected using
reflected and converted seismic waves (Fig. 2.6-15).
5.4.2 Earthquakes in subducting slabs
The deep and intermediate earthquakes forming the Wadati–
Benioff zone extend in some places to depths of almost 700 km
(Fig. 5.4-9). These are the deepest earthquakes that occur:
away from subduction zones, earthquakes below about 40 km
are rare. The Wadati–Benioff zone earthquakes illustrate that
material cold enough to fail seismically (rather than flow) is
being subducted, and give our best information about the
geometry and mechanics of slabs.
The number of earthquakes as a function of depth illustrates
why we distinguish intermediate and deep earthquakes; seismicity decreases to a minimum near about 300 km, and then
increases again. Deep earthquakes, those below about 300 km,
are thus generally treated as distinct from intermediate earthquakes. Deep earthquakes peak at about 600 km, and then
decline to a minimum before 700 km. The focal mechanisms
also vary with depth; those shallower than 300 km show generally down-dip tension, whereas those below 300 km show
generally down-dip compression (Fig. 5.4-10).
Various explanations for this distribution of earthquakes
and focal mechanisms are under consideration. One is that
near the surface the slab is extended by its own weight, whereas
at depth it encounters stronger lower mantle material, causing down-dip compression. Another possible factor may be
mineral phase changes that occur at different depths in the cold
slab than in the surrounding mantle.
It is generally assumed that the most crucial effect is the
negative buoyancy (sinking) of the cold and dense slabs. The
thermal model gives the force driving the subduction due to
the integrated negative buoyancy of a slab resulting from the
density contrast between it and the warmer and less dense
material at the same depth outside. Because the slab does not
have a discrete lower end in the analytic model, the net force is
200
400
600
800
1000
1200
1400
ISC delay time inversion
Depth (km)
Image of upper mantle slab model
200
400
600
800
1000
1200
1400
Depth (km)
Exact upper mantle slab model
Cell hit count (10-logarithmic contouring)
0
1000 km
2000
2000
1000 km
0
3.5
0
+3%
−3%
Fig. 5.4-7 Comparison of a seismic tomographic image of a subducting slab, indicated by the velocity anomaly and earthquake hypocenters (dots) (upper
left) to the image (lower left) predicted for a slab thermal model. The seismic velocity anomaly predicted by the thermal model (upper right) is imaged by a
simulated tomographic study using the same seismic ray path sampling as the data. The hit count (lower right) shows the number of rays sampling each cell
used in the inversion. As a result of ray geometry and noise, the slab model gives a somewhat distorted image (lower left), showing how the model would
appear in such a tomographic study. The similarity of the image of the model and the tomographic result suggests that the model generally describes the
major features of the actual slab. Left scale bar gives velocity perturbations in percent, with positive values representing fast material. Right scale bar is
for hit count, showing values as logarithm to base 10; the white region in the hit count plot is densely sampled and off scale. (Spakman et al., 1989.
Geophys. Res. Lett., 16, 1097–110, copyright by the American Geophysical Union.)
high-frequency components were more absorbed on the
path to VUN due to higher attenuation (lower Q) than on the
more rigid slab path to NIU. In addition, the sharp contrast in
seismic velocity at the top of slabs can be detected using
reflected and converted seismic waves (Fig. 2.6-15).
5.4.2 Earthquakes in subducting slabs
The deep and intermediate earthquakes forming the Wadati–
Benioff zone extend in some places to depths of almost 700 km
(Fig. 5.4-9). These are the deepest earthquakes that occur:
away from subduction zones, earthquakes below about 40 km
are rare. The Wadati–Benioff zone earthquakes illustrate that
material cold enough to fail seismically (rather than flow) is
being subducted, and give our best information about the
geometry and mechanics of slabs.
The number of earthquakes as a function of depth illustrates
why we distinguish intermediate and deep earthquakes; seismicity decreases to a minimum near about 300 km, and then
increases again. Deep earthquakes, those below about 300 km,
are thus generally treated as distinct from intermediate earthquakes. Deep earthquakes peak at about 600 km, and then
decline to a minimum before 700 km. The focal mechanisms
also vary with depth; those shallower than 300 km show generally down-dip tension, whereas those below 300 km show
generally down-dip compression (Fig. 5.4-10).
Various explanations for this distribution of earthquakes
and focal mechanisms are under consideration. One is that
near the surface the slab is extended by its own weight, whereas
at depth it encounters stronger lower mantle material, causing down-dip compression. Another possible factor may be
mineral phase changes that occur at different depths in the cold
slab than in the surrounding mantle.
It is generally assumed that the most crucial effect is the
negative buoyancy (sinking) of the cold and dense slabs. The
thermal model gives the force driving the subduction due to
the integrated negative buoyancy of a slab resulting from the
density contrast between it and the warmer and less dense
material at the same depth outside. Because the slab does not
have a discrete lower end in the analytic model, the net force is