

depth z 0 , the base of the plate, is T K
0 , we integrate Eqn 10 to find
the absolute temperature at depth z,
T K (z) = T K
0 exp [(αg/C p )(z − z 0 )].
(11)
Another possibly important effect is that of heat sources and
sinks. For example, the olivine to spinel transition, which gives
rise to the 410 km discontinuity outside the slab, should release
heat as it occurs in the slab. Heat might also be generated by
friction at the top of the downgoing slab. The heat produced
is the product of the subduction rate and the shear stress on
the slab interface. The magnitude of this effect is difficult to
estimate. It should not be significant unless the shear stress is
greater than a few kilobars. As discussed later (Section 5.7.5),
the stress on faults is unknown. A further complexity results
from the fact that the viscosity of the mantle, which controls
the stress, decreases exponentially with temperature. Thus, if
frictional heating raises the temperature at the slab interface,
viscosity, and hence stress, would decrease, tending to counteract the effect.
To address these complexities, we use numerical models to
solve the heat equation at every point in the slab. These models
allow parameters such as density to vary with position. In addition, heat sources and sinks such as radioactive heating, phase
changes, and frictional heating can be incorporated. The
results of such calculations are similar to those of the analytic
model and are used to explore how temperatures should
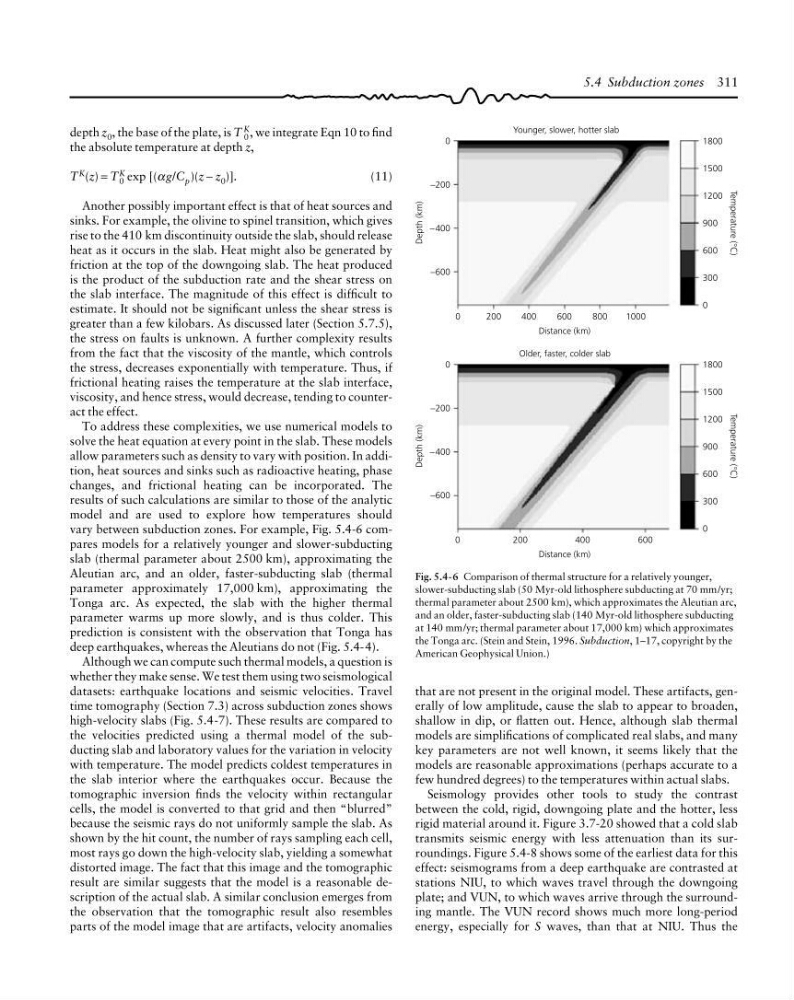
vary between subduction zones. For example, Fig. 5.4-6 compares models for a relatively younger and slower-subducting
slab (thermal parameter about 2500 km), approximating the
Aleutian arc, and an older, faster-subducting slab (thermal
parameter approximately 17,000 km), approximating the
Tonga arc. As expected, the slab with the higher thermal
parameter warms up more slowly, and is thus colder. This
prediction is consistent with the observation that Tonga has
deep earthquakes, whereas the Aleutians do not (Fig. 5.4-4).
Although we can compute such thermal models, a question is
whether they make sense. We test them using two seismological
datasets: earthquake locations and seismic velocities. Travel
time tomography (Section 7.3) across subduction zones shows
high-velocity slabs (Fig. 5.4-7). These results are compared to
the velocities predicted using a thermal model of the subducting slab and laboratory values for the variation in velocity
with temperature. The model predicts coldest temperatures in
the slab interior where the earthquakes occur. Because the
tomographic inversion finds the velocity within rectangular
cells, the model is converted to that grid and then “blurred”
because the seismic rays do not uniformly sample the slab. As
shown by the hit count, the number of rays sampling each cell,
most rays go down the high-velocity slab, yielding a somewhat
distorted image. The fact that this image and the tomographic
result are similar suggests that the model is a reasonable description of the actual slab. A similar conclusion emerges from
the observation that the tomographic result also resembles
parts of the model image that are artifacts, velocity anomalies
Fig. 5.4-6 Comparison of thermal structure for a relatively younger,
slower-subducting slab (50 Myr-old lithosphere subducting at 70 mm/yr;
thermal parameter about 2500 km), which approximates the Aleutian arc,
and an older, faster-subducting slab (140 Myr-old lithosphere subducting
at 140 mm/yr; thermal parameter about 17,000 km) which approximates
the Tonga arc. (Stein and Stein, 1996. Subduction, 1–17, copyright by the
American Geophysical Union.)
Depth (km)
0
−200
−400
−600
1800
1500
1200
900
600
300
0
Younger, slower, hotter slab
Temperature (°C)
0
200
400
600
800
1000
Distance (km)
Older, faster, colder slab
Depth (km)
0
−200
−400
−600
1800
1500
1200
900
600
300
0
Temperature (°C)
0
200
400
600
Distance (km)
that are not present in the original model. These artifacts, generally of low amplitude, cause the slab to appear to broaden,
shallow in dip, or flatten out. Hence, although slab thermal
models are simplifications of complicated real slabs, and many
key parameters are not well known, it seems likely that the
models are reasonable approximations (perhaps accurate to a
few hundred degrees) to the temperatures within actual slabs.
Seismology provides other tools to study the contrast
between the cold, rigid, downgoing plate and the hotter, less
rigid material around it. Figure 3.7-20 showed that a cold slab
transmits seismic energy with less attenuation than its surroundings. Figure 5.4-8 shows some of the earliest data for this
effect: seismograms from a deep earthquake are contrasted at
stations NIU, to which waves travel through the downgoing
plate; and VUN, to which waves arrive through the surrounding mantle. The VUN record shows much more long-period
energy, especially for S waves, than that at NIU. Thus the
5.4 Subduction zones 311
0 , we integrate Eqn 10 to find
the absolute temperature at depth z,
T K (z) = T K
0 exp [(αg/C p )(z − z 0 )].
(11)
Another possibly important effect is that of heat sources and
sinks. For example, the olivine to spinel transition, which gives
rise to the 410 km discontinuity outside the slab, should release
heat as it occurs in the slab. Heat might also be generated by
friction at the top of the downgoing slab. The heat produced
is the product of the subduction rate and the shear stress on
the slab interface. The magnitude of this effect is difficult to
estimate. It should not be significant unless the shear stress is
greater than a few kilobars. As discussed later (Section 5.7.5),
the stress on faults is unknown. A further complexity results
from the fact that the viscosity of the mantle, which controls
the stress, decreases exponentially with temperature. Thus, if
frictional heating raises the temperature at the slab interface,
viscosity, and hence stress, would decrease, tending to counteract the effect.
To address these complexities, we use numerical models to
solve the heat equation at every point in the slab. These models
allow parameters such as density to vary with position. In addition, heat sources and sinks such as radioactive heating, phase
changes, and frictional heating can be incorporated. The
results of such calculations are similar to those of the analytic
model and are used to explore how temperatures should
vary between subduction zones. For example, Fig. 5.4-6 compares models for a relatively younger and slower-subducting
slab (thermal parameter about 2500 km), approximating the
Aleutian arc, and an older, faster-subducting slab (thermal
parameter approximately 17,000 km), approximating the
Tonga arc. As expected, the slab with the higher thermal
parameter warms up more slowly, and is thus colder. This
prediction is consistent with the observation that Tonga has
deep earthquakes, whereas the Aleutians do not (Fig. 5.4-4).
Although we can compute such thermal models, a question is
whether they make sense. We test them using two seismological
datasets: earthquake locations and seismic velocities. Travel
time tomography (Section 7.3) across subduction zones shows
high-velocity slabs (Fig. 5.4-7). These results are compared to
the velocities predicted using a thermal model of the subducting slab and laboratory values for the variation in velocity
with temperature. The model predicts coldest temperatures in
the slab interior where the earthquakes occur. Because the
tomographic inversion finds the velocity within rectangular
cells, the model is converted to that grid and then “blurred”
because the seismic rays do not uniformly sample the slab. As
shown by the hit count, the number of rays sampling each cell,
most rays go down the high-velocity slab, yielding a somewhat
distorted image. The fact that this image and the tomographic
result are similar suggests that the model is a reasonable description of the actual slab. A similar conclusion emerges from
the observation that the tomographic result also resembles
parts of the model image that are artifacts, velocity anomalies
Fig. 5.4-6 Comparison of thermal structure for a relatively younger,
slower-subducting slab (50 Myr-old lithosphere subducting at 70 mm/yr;
thermal parameter about 2500 km), which approximates the Aleutian arc,
and an older, faster-subducting slab (140 Myr-old lithosphere subducting
at 140 mm/yr; thermal parameter about 17,000 km) which approximates
the Tonga arc. (Stein and Stein, 1996. Subduction, 1–17, copyright by the
American Geophysical Union.)
Depth (km)
0
−200
−400
−600
1800
1500
1200
900
600
300
0
Younger, slower, hotter slab
Temperature (°C)
0
200
400
600
800
1000
Distance (km)
Older, faster, colder slab
Depth (km)
0
−200
−400
−600
1800
1500
1200
900
600
300
0
Temperature (°C)
0
200
400
600
Distance (km)
that are not present in the original model. These artifacts, generally of low amplitude, cause the slab to appear to broaden,
shallow in dip, or flatten out. Hence, although slab thermal
models are simplifications of complicated real slabs, and many
key parameters are not well known, it seems likely that the
models are reasonable approximations (perhaps accurate to a
few hundred degrees) to the temperatures within actual slabs.
Seismology provides other tools to study the contrast
between the cold, rigid, downgoing plate and the hotter, less
rigid material around it. Figure 3.7-20 showed that a cold slab
transmits seismic energy with less attenuation than its surroundings. Figure 5.4-8 shows some of the earliest data for this
effect: seismograms from a deep earthquake are contrasted at
stations NIU, to which waves travel through the downgoing
plate; and VUN, to which waves arrive through the surrounding mantle. The VUN record shows much more long-period
energy, especially for S waves, than that at NIU. Thus the
5.4 Subduction zones 311