

304 Seismology and Plate Tectonics
the low-velocity zone determined from surface wave dispersion
(Figs. 5.3-9c and 2.8-7), all increase with age. Hence the
cooling of oceanic lithosphere causes the expected increase
in strength and seismic velocity. Moreover, as discussed in
Section 5.5, the resulting density increase is thought to provide
a major force driving plate motions.
Because various properties vary with age, the oceanic lithosphere can be defined in various ways, so terms like “seismic
lithosphere,” “elastic lithosphere,” and “thermal lithosphere”
are often used. Interestingly, these thicknesses differ. It looks as
if the deepest earthquakes are bounded by about 600–800 °C,
such that hotter material cannot support seismic failure. The
400
200
0
200
400
Distance from axis (km)
West
East
0
100
200
300
400
Depth (km)
101mm/yr
45 mm/yr
Lithospheric
mantle
Embedded
heterogeneity
410 km Discontinuity
Crust
Incipient
melting
Primary melting
Interlayered mafics/ultramafics
10
9
8
7
6
5
4
3
2
1
0
−1
−2
3.0
4.0
5.0
5.5
6.0
LVZ
Gabbros
7.0 km/s
6.0
5.5
Distance (km)
5.0
6.5
2.5
2.2
7.5
8.0
Mantle ultramafics
Extrusives
Sheeted dikes
3
4
5
6
7
8
9
10
Depth (km)
Brecciated dikes
W
E
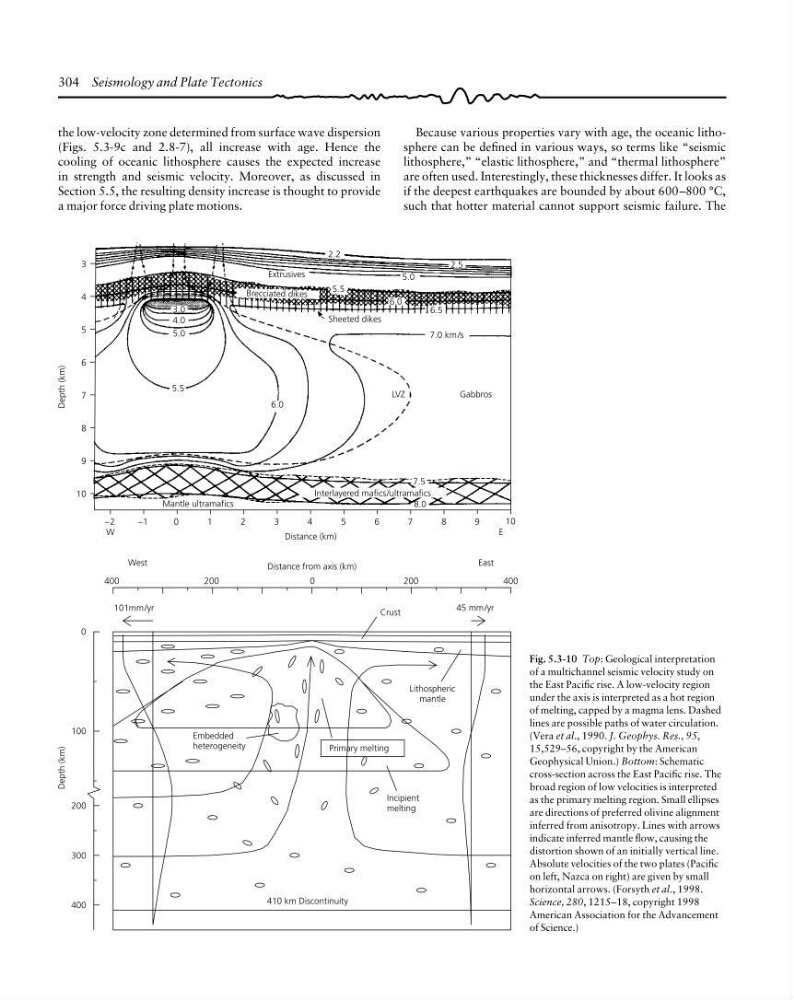
Fig. 5.3-10 Top: Geological interpretation
of a multichannel seismic velocity study on
the East Pacific rise. A low-velocity region
under the axis is interpreted as a hot region
of melting, capped by a magma lens. Dashed
lines are possible paths of water circulation.
(Vera et al., 1990. J. Geophys. Res., 95,
15,529–56, copyright by the American
Geophysical Union.) Bottom: Schematic
cross-section across the East Pacific rise. The
broad region of low velocities is interpreted
as the primary melting region. Small ellipses
are directions of preferred olivine alignment
inferred from anisotropy. Lines with arrows
indicate inferred mantle flow, causing the
distortion shown of an initially vertical line.
Absolute velocities of the two plates (Pacific
on left, Nazca on right) are given by small
horizontal arrows. (Forsyth et al., 1998.
Science, 280, 1215–18, copyright 1998
American Association for the Advancement
of Science.)
the low-velocity zone determined from surface wave dispersion
(Figs. 5.3-9c and 2.8-7), all increase with age. Hence the
cooling of oceanic lithosphere causes the expected increase
in strength and seismic velocity. Moreover, as discussed in
Section 5.5, the resulting density increase is thought to provide
a major force driving plate motions.
Because various properties vary with age, the oceanic lithosphere can be defined in various ways, so terms like “seismic
lithosphere,” “elastic lithosphere,” and “thermal lithosphere”
are often used. Interestingly, these thicknesses differ. It looks as
if the deepest earthquakes are bounded by about 600–800 °C,
such that hotter material cannot support seismic failure. The
400
200
0
200
400
Distance from axis (km)
West
East
0
100
200
300
400
Depth (km)
101mm/yr
45 mm/yr
Lithospheric
mantle
Embedded
heterogeneity
410 km Discontinuity
Crust
Incipient
melting
Primary melting
Interlayered mafics/ultramafics
10
9
8
7
6
5
4
3
2
1
0
−1
−2
3.0
4.0
5.0
5.5
6.0
LVZ
Gabbros
7.0 km/s
6.0
5.5
Distance (km)
5.0
6.5
2.5
2.2
7.5
8.0
Mantle ultramafics
Extrusives
Sheeted dikes
3
4
5
6
7
8
9
10
Depth (km)
Brecciated dikes
W
E
Fig. 5.3-10 Top: Geological interpretation
of a multichannel seismic velocity study on
the East Pacific rise. A low-velocity region
under the axis is interpreted as a hot region
of melting, capped by a magma lens. Dashed
lines are possible paths of water circulation.
(Vera et al., 1990. J. Geophys. Res., 95,
15,529–56, copyright by the American
Geophysical Union.) Bottom: Schematic
cross-section across the East Pacific rise. The
broad region of low velocities is interpreted
as the primary melting region. Small ellipses
are directions of preferred olivine alignment
inferred from anisotropy. Lines with arrows
indicate inferred mantle flow, causing the
distortion shown of an initially vertical line.
Absolute velocities of the two plates (Pacific
on left, Nazca on right) are given by small
horizontal arrows. (Forsyth et al., 1998.
Science, 280, 1215–18, copyright 1998
American Association for the Advancement
of Science.)