

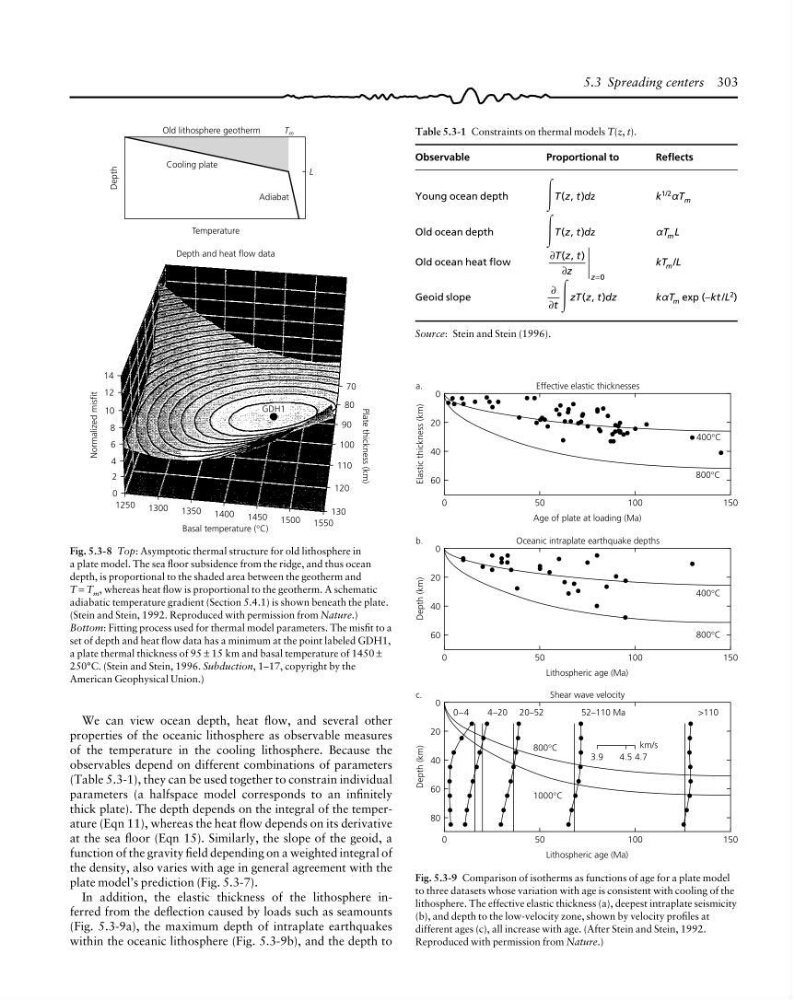
Fig. 5.3-8 Top: Asymptotic thermal structure for old lithosphere in
a plate model. The sea floor subsidence from the ridge, and thus ocean
depth, is proportional to the shaded area between the geotherm and
T = T m , whereas heat flow is proportional to the geotherm. A schematic
adiabatic temperature gradient (Section 5.4.1) is shown beneath the plate.
(Stein and Stein, 1992. Reproduced with permission from Nature.)
Bottom: Fitting process used for thermal model parameters. The misfit to a
set of depth and heat flow data has a minimum at the point labeled GDH1,
a plate thermal thickness of 95 ± 15 km and basal temperature of 1450 ±
250°C. (Stein and Stein, 1996. Subduction, 1–17, copyright by the
American Geophysical Union.)
Normalized misfit
14
1250
Basal temperature (°C)
Plate thickness (km)
130
GDH1
L
Depth
Temperature
Old lithosphere geotherm
T m
Cooling plate
Adiabat
12
10
8
6
4
2
0
1300 1350 1400 1450 1500 1550
120
110
100
90
80
70
Depth and heat flow data
We can view ocean depth, heat flow, and several other
properties of the oceanic lithosphere as observable measures
of the temperature in the cooling lithosphere. Because the
observables depend on different combinations of parameters
(Table 5.3-1), they can be used together to constrain individual
parameters (a halfspace model corresponds to an infinitely
thick plate). The depth depends on the integral of the temperature (Eqn 11), whereas the heat flow depends on its derivative
at the sea floor (Eqn 15). Similarly, the slope of the geoid, a
function of the gravity field depending on a weighted integral of
the density, also varies with age in general agreement with the
plate model’s prediction (Fig. 5.3-7).
In addition, the elastic thickness of the lithosphere inferred from the deflection caused by loads such as seamounts
(Fig. 5.3-9a), the maximum depth of intraplate earthquakes
within the oceanic lithosphere (Fig. 5.3-9b), and the depth to
5.3 Spreading centers 303
Table 5.3-1 Constraints on thermal models T(z, t).
Observable
Proportional to
Reflects
Young ocean depth
Ύ T z t dz
( , )
k
1/2 aT m
Old ocean depth
Ύ T z t dz
( , )
aT m L
Old ocean heat flow
∂
∂
T z t
z
z
( , )
=0
kT m /L
Geoid slope
∂
∂t
zT z t dz
( , )
Ύ
kaT m exp (−kt /L
2 )
Source: Stein and Stein (1996).
Depth (km)
0
20
40
60
80
0
Lithospheric age (Ma)
150
50
100
Shear wave velocity
c.
Depth (km)
0
20
40
60
0
Lithospheric age (Ma)
150
50
100
Oceanic intraplate earthquake depths
b.
0–4
4–20 20–52
52–110 Ma
>110
800°C
1000°C
km/s
3.9
4.5 4.7
Elastic thickness (km)
0
20
40
60
0
Age of plate at loading (Ma)
150
50
100
Effective elastic thicknesses
a.
800°C
400°C
400°C
800°C
Fig. 5.3-9 Comparison of isotherms as functions of age for a plate model
to three datasets whose variation with age is consistent with cooling of the
lithosphere. The effective elastic thickness (a), deepest intraplate seismicity
(b), and depth to the low-velocity zone, shown by velocity profiles at
different ages (c), all increase with age. (After Stein and Stein, 1992.
Reproduced with permission from Nature.)
a plate model. The sea floor subsidence from the ridge, and thus ocean
depth, is proportional to the shaded area between the geotherm and
T = T m , whereas heat flow is proportional to the geotherm. A schematic
adiabatic temperature gradient (Section 5.4.1) is shown beneath the plate.
(Stein and Stein, 1992. Reproduced with permission from Nature.)
Bottom: Fitting process used for thermal model parameters. The misfit to a
set of depth and heat flow data has a minimum at the point labeled GDH1,
a plate thermal thickness of 95 ± 15 km and basal temperature of 1450 ±
250°C. (Stein and Stein, 1996. Subduction, 1–17, copyright by the
American Geophysical Union.)
Normalized misfit
14
1250
Basal temperature (°C)
Plate thickness (km)
130
GDH1
L
Depth
Temperature
Old lithosphere geotherm
T m
Cooling plate
Adiabat
12
10
8
6
4
2
0
1300 1350 1400 1450 1500 1550
120
110
100
90
80
70
Depth and heat flow data
We can view ocean depth, heat flow, and several other
properties of the oceanic lithosphere as observable measures
of the temperature in the cooling lithosphere. Because the
observables depend on different combinations of parameters
(Table 5.3-1), they can be used together to constrain individual
parameters (a halfspace model corresponds to an infinitely
thick plate). The depth depends on the integral of the temperature (Eqn 11), whereas the heat flow depends on its derivative
at the sea floor (Eqn 15). Similarly, the slope of the geoid, a
function of the gravity field depending on a weighted integral of
the density, also varies with age in general agreement with the
plate model’s prediction (Fig. 5.3-7).
In addition, the elastic thickness of the lithosphere inferred from the deflection caused by loads such as seamounts
(Fig. 5.3-9a), the maximum depth of intraplate earthquakes
within the oceanic lithosphere (Fig. 5.3-9b), and the depth to
5.3 Spreading centers 303
Table 5.3-1 Constraints on thermal models T(z, t).
Observable
Proportional to
Reflects
Young ocean depth
Ύ T z t dz
( , )
k
1/2 aT m
Old ocean depth
Ύ T z t dz
( , )
aT m L
Old ocean heat flow
∂
∂
T z t
z
z
( , )
=0
kT m /L
Geoid slope
∂
∂t
zT z t dz
( , )
Ύ
kaT m exp (−kt /L
2 )
Source: Stein and Stein (1996).
Depth (km)
0
20
40
60
80
0
Lithospheric age (Ma)
150
50
100
Shear wave velocity
c.
Depth (km)
0
20
40
60
0
Lithospheric age (Ma)
150
50
100
Oceanic intraplate earthquake depths
b.
0–4
4–20 20–52
52–110 Ma
>110
800°C
1000°C
km/s
3.9
4.5 4.7
Elastic thickness (km)
0
20
40
60
0
Age of plate at loading (Ma)
150
50
100
Effective elastic thicknesses
a.
800°C
400°C
400°C
800°C
Fig. 5.3-9 Comparison of isotherms as functions of age for a plate model
to three datasets whose variation with age is consistent with cooling of the
lithosphere. The effective elastic thickness (a), deepest intraplate seismicity
(b), and depth to the low-velocity zone, shown by velocity profiles at
different ages (c), all increase with age. (After Stein and Stein, 1992.
Reproduced with permission from Nature.)