

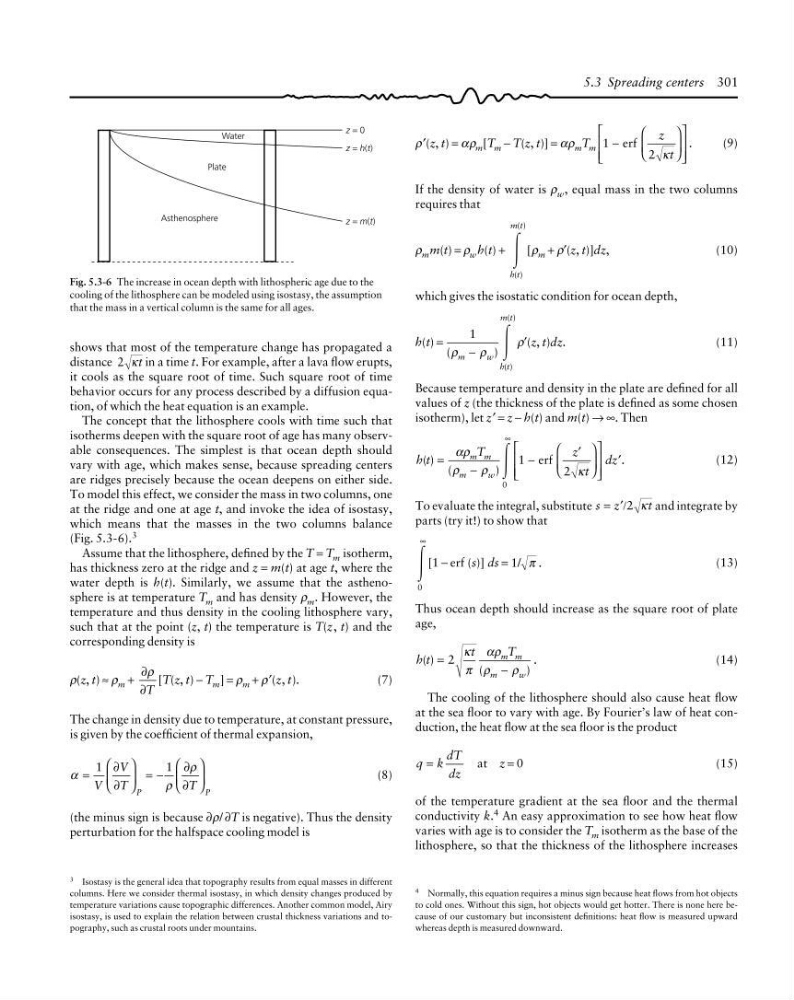
Fig. 5.3-6 The increase in ocean depth with lithospheric age due to the
cooling of the lithosphere can be modeled using isostasy, the assumption
that the mass in a vertical column is the same for all ages.
Water
z = 0
z = h(t)
z = m(t)
Plate
Asthenosphere
3 Isostasy is the general idea that topography results from equal masses in different
columns. Here we consider thermal isostasy, in which density changes produced by
temperature variations cause topographic differences. Another common model, Airy
isostasy, is used to explain the relation between crustal thickness variations and topography, such as crustal roots under mountains.
4 Normally, this equation requires a minus sign because heat flows from hot objects
to cold ones. Without this sign, hot objects would get hotter. There is none here because of our customary but inconsistent definitions: heat flow is measured upward
whereas depth is measured downward.
5.3 Spreading centers 301
shows that most of the temperature change has propagated a
distance 2 κt in a time t. For example, after a lava flow erupts,
it cools as the square root of time. Such square root of time
behavior occurs for any process described by a diffusion equation, of which the heat equation is an example.
The concept that the lithosphere cools with time such that
isotherms deepen with the square root of age has many observable consequences. The simplest is that ocean depth should
vary with age, which makes sense, because spreading centers
are ridges precisely because the ocean deepens on either side.
To model this effect, we consider the mass in two columns, one
at the ridge and one at age t, and invoke the idea of isostasy,
which means that the masses in the two columns balance
(Fig. 5.3-6). 3
Assume that the lithosphere, defined by the T = T m isotherm,
has thickness zero at the ridge and z = m(t) at age t, where the
water depth is h(t). Similarly, we assume that the asthenosphere is at temperature T m and has density ρ m . However, the
temperature and thus density in the cooling lithosphere vary,
such that at the point (z, t) the temperature is T(z, t) and the
corresponding density is
ρ(z, t) ≈ ρ m +
∂
∂
ρ
T
[T(z, t) − T m ] = ρ m + ρ′(z, t).
(7)
The change in density due to temperature, at constant pressure,
is given by the coefficient of thermal expansion,
α
ρ
ρ
=
⎛
⎝
⎜
⎞
⎠
⎟ = −
⎛
⎝
⎜
⎞
⎠
⎟
1
1
V
V
T
T
P
P
∂
∂
∂
∂
(8)
(the minus sign is because ∂ρ/ ∂T is negative). Thus the density
perturbation for the halfspace cooling model is
ρ′(z, t) = αρ m [T m − T(z, t)] = αρ m T m 1
2
.
−
⎛
⎝
⎜
⎞
⎠
⎟
⎡
⎣
⎢
⎢
⎤
⎦
⎥
⎥
erf
z
t
κ
(9)
If the density of water is ρ w , equal mass in the two columns
requires that
ρ m m(t) = ρ w h(t) +
Ύ
h t
m t
( )
( )
[ρ m + ρ′(z, t)]dz,
(10)
which gives the isostatic condition for ocean depth,
h(t) =
1
(
)
( )
( )
ρ
ρ
m
w
h t
m t
−
Ύ
ρ′(z, t)dz.
(11)
Because temperature and density in the plate are defined for all
values of z (the thickness of the plate is defined as some chosen
isotherm), let z′ = z − h(t) and m(t) → ∞. Then
h t
T
z
t
dz
m m
m
w
( )
(
)
.
=
−
−
⎛
⎝
⎜
⎞
⎠
⎟
⎡
⎣
⎢
⎢
⎤
⎦
⎥
⎥
∞
αρ
ρ
ρ
κ
Ύ
0
1
2
erf
′
′
(12)
To evaluate the integral, substitute s z
t
= ′/2 κ and integrate by
parts (try it!) to show that
Ύ
0
∞
[1 − erf (s)] ds = 1/ .
π
(13)
Thus ocean depth should increase as the square root of plate
age,
h t
t
T
m m
m
w
( )
(
)
.
=
−
2
κ
π
αρ
ρ
ρ
(14)
The cooling of the lithosphere should also cause heat flow
at the sea floor to vary with age. By Fourier’s law of heat conduction, the heat flow at the sea floor is the product
q k
dT
dz
=
at z = 0
(15)
of the temperature gradient at the sea floor and the thermal
conductivity k.
4 An easy approximation to see how heat flow
varies with age is to consider the T m isotherm as the base of the
lithosphere, so that the thickness of the lithosphere increases
cooling of the lithosphere can be modeled using isostasy, the assumption
that the mass in a vertical column is the same for all ages.
Water
z = 0
z = h(t)
z = m(t)
Plate
Asthenosphere
3 Isostasy is the general idea that topography results from equal masses in different
columns. Here we consider thermal isostasy, in which density changes produced by
temperature variations cause topographic differences. Another common model, Airy
isostasy, is used to explain the relation between crustal thickness variations and topography, such as crustal roots under mountains.
4 Normally, this equation requires a minus sign because heat flows from hot objects
to cold ones. Without this sign, hot objects would get hotter. There is none here because of our customary but inconsistent definitions: heat flow is measured upward
whereas depth is measured downward.
5.3 Spreading centers 301
shows that most of the temperature change has propagated a
distance 2 κt in a time t. For example, after a lava flow erupts,
it cools as the square root of time. Such square root of time
behavior occurs for any process described by a diffusion equation, of which the heat equation is an example.
The concept that the lithosphere cools with time such that
isotherms deepen with the square root of age has many observable consequences. The simplest is that ocean depth should
vary with age, which makes sense, because spreading centers
are ridges precisely because the ocean deepens on either side.
To model this effect, we consider the mass in two columns, one
at the ridge and one at age t, and invoke the idea of isostasy,
which means that the masses in the two columns balance
(Fig. 5.3-6). 3
Assume that the lithosphere, defined by the T = T m isotherm,
has thickness zero at the ridge and z = m(t) at age t, where the
water depth is h(t). Similarly, we assume that the asthenosphere is at temperature T m and has density ρ m . However, the
temperature and thus density in the cooling lithosphere vary,
such that at the point (z, t) the temperature is T(z, t) and the
corresponding density is
ρ(z, t) ≈ ρ m +
∂
∂
ρ
T
[T(z, t) − T m ] = ρ m + ρ′(z, t).
(7)
The change in density due to temperature, at constant pressure,
is given by the coefficient of thermal expansion,
α
ρ
ρ
=
⎛
⎝
⎜
⎞
⎠
⎟ = −
⎛
⎝
⎜
⎞
⎠
⎟
1
1
V
V
T
T
P
P
∂
∂
∂
∂
(8)
(the minus sign is because ∂ρ/ ∂T is negative). Thus the density
perturbation for the halfspace cooling model is
ρ′(z, t) = αρ m [T m − T(z, t)] = αρ m T m 1
2
.
−
⎛
⎝
⎜
⎞
⎠
⎟
⎡
⎣
⎢
⎢
⎤
⎦
⎥
⎥
erf
z
t
κ
(9)
If the density of water is ρ w , equal mass in the two columns
requires that
ρ m m(t) = ρ w h(t) +
Ύ
h t
m t
( )
( )
[ρ m + ρ′(z, t)]dz,
(10)
which gives the isostatic condition for ocean depth,
h(t) =
1
(
)
( )
( )
ρ
ρ
m
w
h t
m t
−
Ύ
ρ′(z, t)dz.
(11)
Because temperature and density in the plate are defined for all
values of z (the thickness of the plate is defined as some chosen
isotherm), let z′ = z − h(t) and m(t) → ∞. Then
h t
T
z
t
dz
m m
m
w
( )
(
)
.
=
−
−
⎛
⎝
⎜
⎞
⎠
⎟
⎡
⎣
⎢
⎢
⎤
⎦
⎥
⎥
∞
αρ
ρ
ρ
κ
Ύ
0
1
2
erf
′
′
(12)
To evaluate the integral, substitute s z
t
= ′/2 κ and integrate by
parts (try it!) to show that
Ύ
0
∞
[1 − erf (s)] ds = 1/ .
π
(13)
Thus ocean depth should increase as the square root of plate
age,
h t
t
T
m m
m
w
( )
(
)
.
=
−
2
κ
π
αρ
ρ
ρ
(14)
The cooling of the lithosphere should also cause heat flow
at the sea floor to vary with age. By Fourier’s law of heat conduction, the heat flow at the sea floor is the product
q k
dT
dz
=
at z = 0
(15)
of the temperature gradient at the sea floor and the thermal
conductivity k.
4 An easy approximation to see how heat flow
varies with age is to consider the T m isotherm as the base of the
lithosphere, so that the thickness of the lithosphere increases