

Earthquakes are among the best tools for investigating plate
boundary zones and other deviations from plate rigidity. They
provide one of the best indicators of the location of boundary
zones, so new earthquakes often change our views. We also
use plate motion data, many of which are earthquake slip vectors. For example, Fig. 5.2-4 shows zones of seismicity in the
Central Indian Ocean (Section 5.5.2) as boundaries between
distinct Indian and Australian plates, rather than as within a
single Indo-Australian plate, because spreading rates along the
Central Indian Ocean ridge are better fit by a two-plate model.
A similar argument justifies the assumption of a small Rivera
plate distinct from the Cocos plate. Another approach is to use
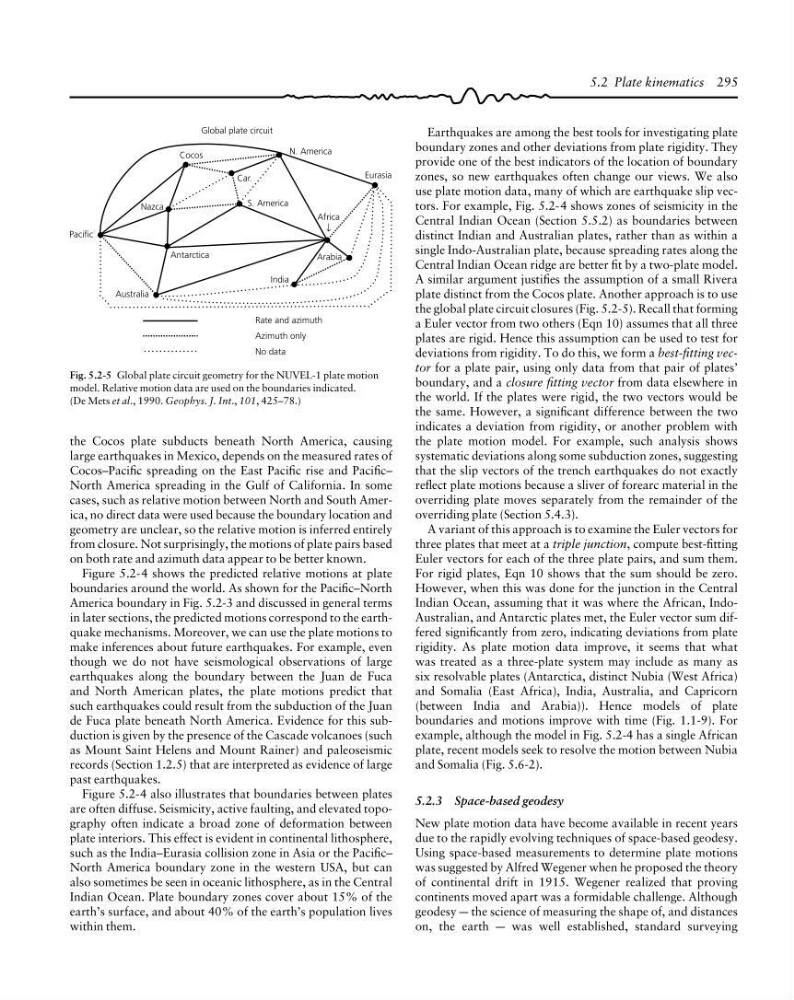
the global plate circuit closures (Fig. 5.2-5). Recall that forming
a Euler vector from two others (Eqn 10) assumes that all three
plates are rigid. Hence this assumption can be used to test for
deviations from rigidity. To do this, we form a best-fitting vector for a plate pair, using only data from that pair of plates’
boundary, and a closure fitting vector from data elsewhere in
the world. If the plates were rigid, the two vectors would be
the same. However, a significant difference between the two
indicates a deviation from rigidity, or another problem with
the plate motion model. For example, such analysis shows
systematic deviations along some subduction zones, suggesting
that the slip vectors of the trench earthquakes do not exactly
reflect plate motions because a sliver of forearc material in the
overriding plate moves separately from the remainder of the
overriding plate (Section 5.4.3).
A variant of this approach is to examine the Euler vectors for
three plates that meet at a triple junction, compute best-fitting
Euler vectors for each of the three plate pairs, and sum them.
For rigid plates, Eqn 10 shows that the sum should be zero.
However, when this was done for the junction in the Central
Indian Ocean, assuming that it was where the African, IndoAustralian, and Antarctic plates met, the Euler vector sum differed significantly from zero, indicating deviations from plate
rigidity. As plate motion data improve, it seems that what
was treated as a three-plate system may include as many as
six resolvable plates (Antarctica, distinct Nubia (West Africa)
and Somalia (East Africa), India, Australia, and Capricorn
(between India and Arabia)). Hence models of plate
boundaries and motions improve with time (Fig. 1.1-9). For
example, although the model in Fig. 5.2-4 has a single African
plate, recent models seek to resolve the motion between Nubia
and Somalia (Fig. 5.6-2).
5.2.3 Space-based geodesy
New plate motion data have become available in recent years
due to the rapidly evolving techniques of space-based geodesy.
Using space-based measurements to determine plate motions
was suggested by Alfred Wegener when he proposed the theory
of continental drift in 1915. Wegener realized that proving
continents moved apart was a formidable challenge. Although
geodesy a the science of measuring the shape of, and distances
on, the earth a was well established, standard surveying
Fig. 5.2-5 Global plate circuit geometry for the NUVEL-1 plate motion
model. Relative motion data are used on the boundaries indicated.
(De Mets et al., 1990. Geophys. J. Int., 101, 425–78.)
5.2 Plate kinematics 295
Pacific
Australia
Eurasia
Global plate circuit
Cocos
S. America
N. America
Nazca
India
Arabia
Antarctica
Rate and azimuth
Azimuth only
No data
Car.
Africa
↓
the Cocos plate subducts beneath North America, causing
large earthquakes in Mexico, depends on the measured rates of
Cocos–Pacific spreading on the East Pacific rise and Pacific–
North America spreading in the Gulf of California. In some
cases, such as relative motion between North and South America, no direct data were used because the boundary location and
geometry are unclear, so the relative motion is inferred entirely
from closure. Not surprisingly, the motions of plate pairs based
on both rate and azimuth data appear to be better known.
Figure 5.2-4 shows the predicted relative motions at plate
boundaries around the world. As shown for the Pacific–North
America boundary in Fig. 5.2-3 and discussed in general terms
in later sections, the predicted motions correspond to the earthquake mechanisms. Moreover, we can use the plate motions to
make inferences about future earthquakes. For example, even
though we do not have seismological observations of large
earthquakes along the boundary between the Juan de Fuca
and North American plates, the plate motions predict that
such earthquakes could result from the subduction of the Juan
de Fuca plate beneath North America. Evidence for this subduction is given by the presence of the Cascade volcanoes (such
as Mount Saint Helens and Mount Rainer) and paleoseismic
records (Section 1.2.5) that are interpreted as evidence of large
past earthquakes.
Figure 5.2-4 also illustrates that boundaries between plates
are often diffuse. Seismicity, active faulting, and elevated topography often indicate a broad zone of deformation between
plate interiors. This effect is evident in continental lithosphere,
such as the India–Eurasia collision zone in Asia or the Pacific–
North America boundary zone in the western USA, but can
also sometimes be seen in oceanic lithosphere, as in the Central
Indian Ocean. Plate boundary zones cover about 15% of the
earth’s surface, and about 40% of the earth’s population lives
within them.
boundary zones and other deviations from plate rigidity. They
provide one of the best indicators of the location of boundary
zones, so new earthquakes often change our views. We also
use plate motion data, many of which are earthquake slip vectors. For example, Fig. 5.2-4 shows zones of seismicity in the
Central Indian Ocean (Section 5.5.2) as boundaries between
distinct Indian and Australian plates, rather than as within a
single Indo-Australian plate, because spreading rates along the
Central Indian Ocean ridge are better fit by a two-plate model.
A similar argument justifies the assumption of a small Rivera
plate distinct from the Cocos plate. Another approach is to use
the global plate circuit closures (Fig. 5.2-5). Recall that forming
a Euler vector from two others (Eqn 10) assumes that all three
plates are rigid. Hence this assumption can be used to test for
deviations from rigidity. To do this, we form a best-fitting vector for a plate pair, using only data from that pair of plates’
boundary, and a closure fitting vector from data elsewhere in
the world. If the plates were rigid, the two vectors would be
the same. However, a significant difference between the two
indicates a deviation from rigidity, or another problem with
the plate motion model. For example, such analysis shows
systematic deviations along some subduction zones, suggesting
that the slip vectors of the trench earthquakes do not exactly
reflect plate motions because a sliver of forearc material in the
overriding plate moves separately from the remainder of the
overriding plate (Section 5.4.3).
A variant of this approach is to examine the Euler vectors for
three plates that meet at a triple junction, compute best-fitting
Euler vectors for each of the three plate pairs, and sum them.
For rigid plates, Eqn 10 shows that the sum should be zero.
However, when this was done for the junction in the Central
Indian Ocean, assuming that it was where the African, IndoAustralian, and Antarctic plates met, the Euler vector sum differed significantly from zero, indicating deviations from plate
rigidity. As plate motion data improve, it seems that what
was treated as a three-plate system may include as many as
six resolvable plates (Antarctica, distinct Nubia (West Africa)
and Somalia (East Africa), India, Australia, and Capricorn
(between India and Arabia)). Hence models of plate
boundaries and motions improve with time (Fig. 1.1-9). For
example, although the model in Fig. 5.2-4 has a single African
plate, recent models seek to resolve the motion between Nubia
and Somalia (Fig. 5.6-2).
5.2.3 Space-based geodesy
New plate motion data have become available in recent years
due to the rapidly evolving techniques of space-based geodesy.
Using space-based measurements to determine plate motions
was suggested by Alfred Wegener when he proposed the theory
of continental drift in 1915. Wegener realized that proving
continents moved apart was a formidable challenge. Although
geodesy a the science of measuring the shape of, and distances
on, the earth a was well established, standard surveying
Fig. 5.2-5 Global plate circuit geometry for the NUVEL-1 plate motion
model. Relative motion data are used on the boundaries indicated.
(De Mets et al., 1990. Geophys. J. Int., 101, 425–78.)
5.2 Plate kinematics 295
Pacific
Australia
Eurasia
Global plate circuit
Cocos
S. America
N. America
Nazca
India
Arabia
Antarctica
Rate and azimuth
Azimuth only
No data
Car.
Africa
↓
the Cocos plate subducts beneath North America, causing
large earthquakes in Mexico, depends on the measured rates of
Cocos–Pacific spreading on the East Pacific rise and Pacific–
North America spreading in the Gulf of California. In some
cases, such as relative motion between North and South America, no direct data were used because the boundary location and
geometry are unclear, so the relative motion is inferred entirely
from closure. Not surprisingly, the motions of plate pairs based
on both rate and azimuth data appear to be better known.
Figure 5.2-4 shows the predicted relative motions at plate
boundaries around the world. As shown for the Pacific–North
America boundary in Fig. 5.2-3 and discussed in general terms
in later sections, the predicted motions correspond to the earthquake mechanisms. Moreover, we can use the plate motions to
make inferences about future earthquakes. For example, even
though we do not have seismological observations of large
earthquakes along the boundary between the Juan de Fuca
and North American plates, the plate motions predict that
such earthquakes could result from the subduction of the Juan
de Fuca plate beneath North America. Evidence for this subduction is given by the presence of the Cascade volcanoes (such
as Mount Saint Helens and Mount Rainer) and paleoseismic
records (Section 1.2.5) that are interpreted as evidence of large
past earthquakes.
Figure 5.2-4 also illustrates that boundaries between plates
are often diffuse. Seismicity, active faulting, and elevated topography often indicate a broad zone of deformation between
plate interiors. This effect is evident in continental lithosphere,
such as the India–Eurasia collision zone in Asia or the Pacific–
North America boundary zone in the western USA, but can
also sometimes be seen in oceanic lithosphere, as in the Central
Indian Ocean. Plate boundary zones cover about 15% of the
earth’s surface, and about 40% of the earth’s population lives
within them.