

294 Seismology and Plate Tectonics
Table 5.2-1 Euler vectors with respect to North America (NA).
Plate
Pole latitude (°N)
Longitude (°E)
| w | (°/Myr)
Pacific (PA)
−48.709
101.833
0.7486
Africa (AF)
78.807
38.279
0.2380
Antarctica (AN)
60.511
119.619
0.2540
Arabia (AR)
44.132
25.586
0.5688
Australia (AU)
29.112
49.006
0.7579
Caribbean (CA)
74.346
153.892
0.1031
Cocos (CO)
27.883
−120.679
1.3572
Eurasia (EU)
62.408
135.831
0.2137
India (IN)
43.281
29.570
0.5803
Nazca (NZ)
61.544
−109.781
0.6362
South America (SA)
−16.290
121.876
0.1465
Juan de Fuca (JF)
−22.417
67.203
0.8297
Philippine (PH)
−43.986
−19.814
0.8389
Rivera (RI)
22.821
−109.407
1.8032
Scotia (SC)
−43.459
123.120
0.0925
NNR*
2.429
93.965
0.2064
Source: After DeMets et al. 1994.
*No net rotation, defined in Section 5.2.4.
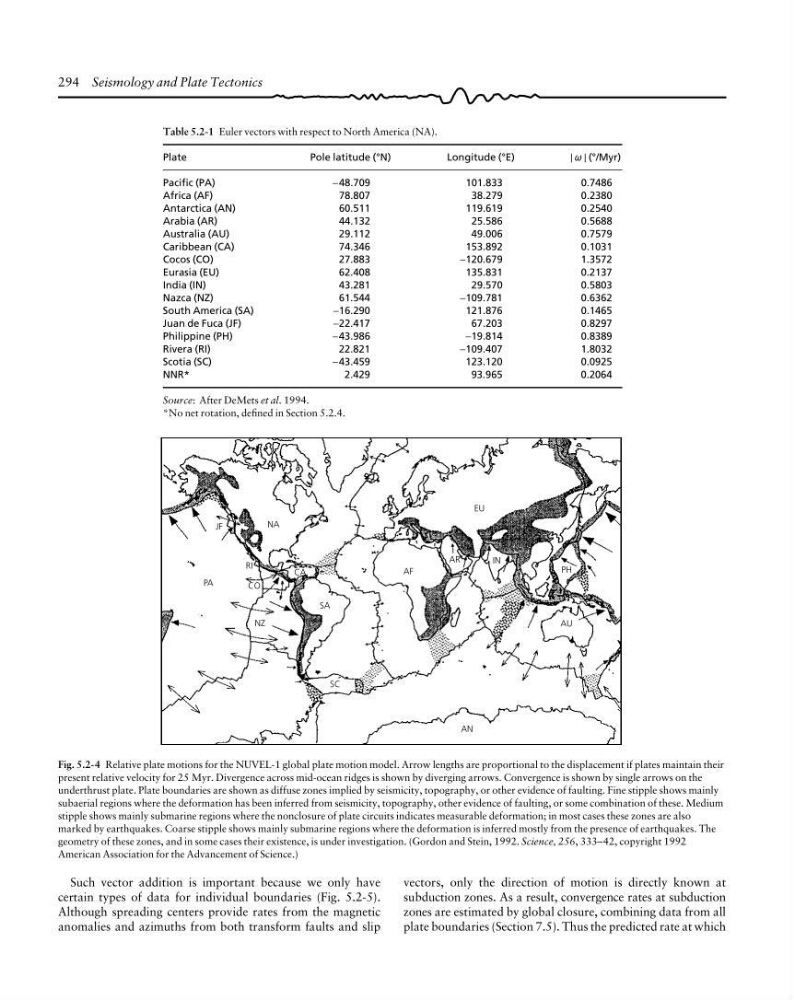
Fig. 5.2-4 Relative plate motions for the NUVEL-1 global plate motion model. Arrow lengths are proportional to the displacement if plates maintain their
present relative velocity for 25 Myr. Divergence across mid-ocean ridges is shown by diverging arrows. Convergence is shown by single arrows on the
underthrust plate. Plate boundaries are shown as diffuse zones implied by seismicity, topography, or other evidence of faulting. Fine stipple shows mainly
subaerial regions where the deformation has been inferred from seismicity, topography, other evidence of faulting, or some combination of these. Medium
stipple shows mainly submarine regions where the nonclosure of plate circuits indicates measurable deformation; in most cases these zones are also
marked by earthquakes. Coarse stipple shows mainly submarine regions where the deformation is inferred mostly from the presence of earthquakes. The
geometry of these zones, and in some cases their existence, is under investigation. (Gordon and Stein, 1992. Science, 256, 333–42, copyright 1992
American Association for the Advancement of Science.)
PA
NA
SA
CO
RI
JF
AF
NZ
SC
AN
AU
PH
EU
AR
IN
CA
Such vector addition is important because we only have
certain types of data for individual boundaries (Fig. 5.2-5).
Although spreading centers provide rates from the magnetic
anomalies and azimuths from both transform faults and slip
vectors, only the direction of motion is directly known at
subduction zones. As a result, convergence rates at subduction
zones are estimated by global closure, combining data from all
plate boundaries (Section 7.5). Thus the predicted rate at which
Table 5.2-1 Euler vectors with respect to North America (NA).
Plate
Pole latitude (°N)
Longitude (°E)
| w | (°/Myr)
Pacific (PA)
−48.709
101.833
0.7486
Africa (AF)
78.807
38.279
0.2380
Antarctica (AN)
60.511
119.619
0.2540
Arabia (AR)
44.132
25.586
0.5688
Australia (AU)
29.112
49.006
0.7579
Caribbean (CA)
74.346
153.892
0.1031
Cocos (CO)
27.883
−120.679
1.3572
Eurasia (EU)
62.408
135.831
0.2137
India (IN)
43.281
29.570
0.5803
Nazca (NZ)
61.544
−109.781
0.6362
South America (SA)
−16.290
121.876
0.1465
Juan de Fuca (JF)
−22.417
67.203
0.8297
Philippine (PH)
−43.986
−19.814
0.8389
Rivera (RI)
22.821
−109.407
1.8032
Scotia (SC)
−43.459
123.120
0.0925
NNR*
2.429
93.965
0.2064
Source: After DeMets et al. 1994.
*No net rotation, defined in Section 5.2.4.
Fig. 5.2-4 Relative plate motions for the NUVEL-1 global plate motion model. Arrow lengths are proportional to the displacement if plates maintain their
present relative velocity for 25 Myr. Divergence across mid-ocean ridges is shown by diverging arrows. Convergence is shown by single arrows on the
underthrust plate. Plate boundaries are shown as diffuse zones implied by seismicity, topography, or other evidence of faulting. Fine stipple shows mainly
subaerial regions where the deformation has been inferred from seismicity, topography, other evidence of faulting, or some combination of these. Medium
stipple shows mainly submarine regions where the nonclosure of plate circuits indicates measurable deformation; in most cases these zones are also
marked by earthquakes. Coarse stipple shows mainly submarine regions where the deformation is inferred mostly from the presence of earthquakes. The
geometry of these zones, and in some cases their existence, is under investigation. (Gordon and Stein, 1992. Science, 256, 333–42, copyright 1992
American Association for the Advancement of Science.)
PA
NA
SA
CO
RI
JF
AF
NZ
SC
AN
AU
PH
EU
AR
IN
CA
Such vector addition is important because we only have
certain types of data for individual boundaries (Fig. 5.2-5).
Although spreading centers provide rates from the magnetic
anomalies and azimuths from both transform faults and slip
vectors, only the direction of motion is directly known at
subduction zones. As a result, convergence rates at subduction
zones are estimated by global closure, combining data from all
plate boundaries (Section 7.5). Thus the predicted rate at which