

280 Earthquakes
thus shows clustered earthquakes resulting from the random
sampling. In the limit of very long histories, the Poisson process
has a standard deviation of recurrence intervals equal to its
mean. Thus a recurrence history with standard deviation close
to the mean favors a Poisson process, whereas a standard deviation significantly smaller than the mean suggests a Gaussian
or other time-dependent process. How to interpret the limited
earthquake histories available is an interesting question, as
illustrated by this simple example with ten recurrences, which
is longer than usually available.
These examples bear out that estimates of earthquake probabilities depend significantly on both the probability distribution used and the parameters for that distribution, which are
generally not well constrained by observations. For example,
the analysis in Fig. 4.7-9 used a Gaussian distribution with a
mean and standard deviation of 194 and 58 years, corresponding to the most recent five major earthquakes at Pallett Creek.
Alternatively, the past ten earthquakes there yield a recurrence with a mean and standard deviation of 132 and 105 years
(Section 1.2.5). Other probability distributions give different
probability estimates, as illustrated by the curves in Fig. 4.7-9
corresponding to Poisson and Weibull distributions. Similarly,
different estimates would result from using a log-normal distribution in which the natural logarithm of recurrence time is
normally distributed, so recurrence intervals longer than the
mean are more likely than shorter ones.
Hence earthquake forecasts are easy to make, but hard to
test. Because the estimates must be tested using data that
were not used to derive them, hundreds or thousands of years
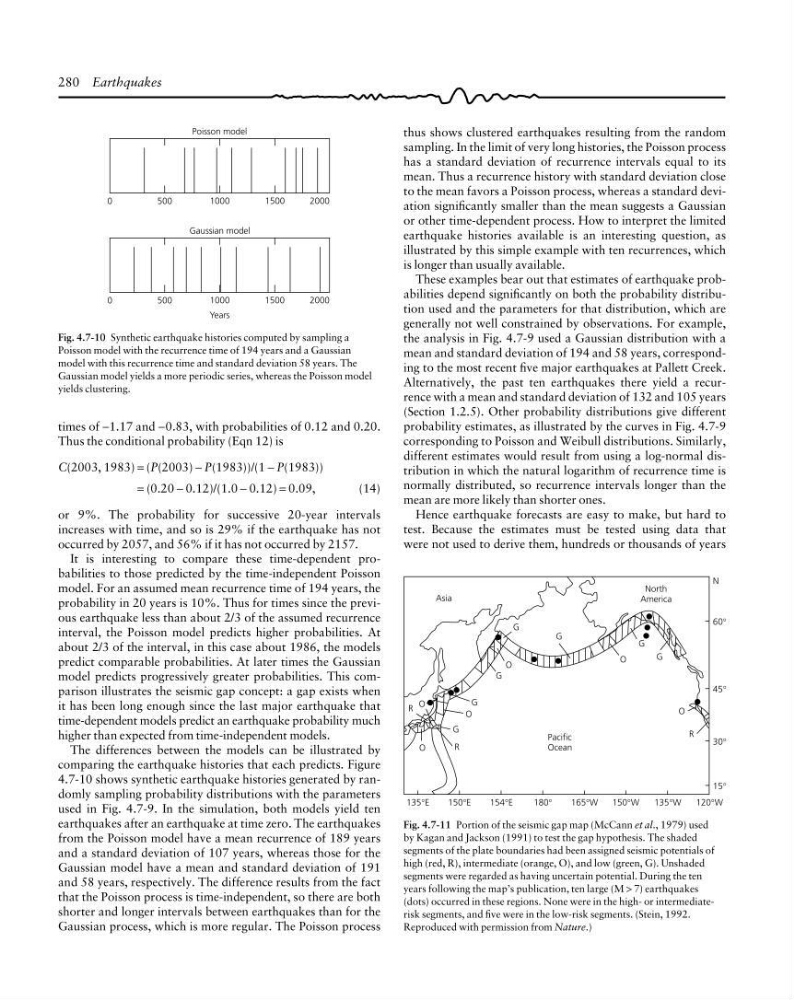
Fig. 4.7-10 Synthetic earthquake histories computed by sampling a
Poisson model with the recurrence time of 194 years and a Gaussian
model with this recurrence time and standard deviation 58 years. The
Gaussian model yields a more periodic series, whereas the Poisson model
yields clustering.
500
Poisson model
0
1000
1500
2000
500
Gaussian model
0
1000
1500
2000
Years
Fig. 4.7-11 Portion of the seismic gap map (McCann et al., 1979) used
by Kagan and Jackson (1991) to test the gap hypothesis. The shaded
segments of the plate boundaries had been assigned seismic potentials of
high (red, R), intermediate (orange, O), and low (green, G). Unshaded
segments were regarded as having uncertain potential. During the ten
years following the map’s publication, ten large (M > 7) earthquakes
(dots) occurred in these regions. None were in the high- or intermediaterisk segments, and five were in the low-risk segments. (Stein, 1992.
Reproduced with permission from Nature.)
60°
135°E
O
150°E
154°E
180°
165°W
150°W
135°W
120°W
Pacific
Ocean
45°
30°
15°
G
R
O
O
R
G
O
O
G
Asia
G
G
North
America
G
G
R
O
N
times of −1.17 and −0.83, with probabilities of 0.12 and 0.20.
Thus the conditional probability (Eqn 12) is
C(2003, 1983) = (P(2003) − P(1983))/(1 − P(1983))
= (0.20 − 0.12)/(1.0 − 0.12) = 0.09,
(14)
or 9%. The probability for successive 20-year intervals
increases with time, and so is 29% if the earthquake has not
occurred by 2057, and 56% if it has not occurred by 2157.
It is interesting to compare these time-dependent probabilities to those predicted by the time-independent Poisson
model. For an assumed mean recurrence time of 194 years, the
probability in 20 years is 10%. Thus for times since the previous earthquake less than about 2/3 of the assumed recurrence
interval, the Poisson model predicts higher probabilities. At
about 2/3 of the interval, in this case about 1986, the models
predict comparable probabilities. At later times the Gaussian
model predicts progressively greater probabilities. This comparison illustrates the seismic gap concept: a gap exists when
it has been long enough since the last major earthquake that
time-dependent models predict an earthquake probability much
higher than expected from time-independent models.
The differences between the models can be illustrated by
comparing the earthquake histories that each predicts. Figure
4.7-10 shows synthetic earthquake histories generated by randomly sampling probability distributions with the parameters
used in Fig. 4.7-9. In the simulation, both models yield ten
earthquakes after an earthquake at time zero. The earthquakes
from the Poisson model have a mean recurrence of 189 years
and a standard deviation of 107 years, whereas those for the
Gaussian model have a mean and standard deviation of 191
and 58 years, respectively. The difference results from the fact
that the Poisson process is time-independent, so there are both
shorter and longer intervals between earthquakes than for the
Gaussian process, which is more regular. The Poisson process
thus shows clustered earthquakes resulting from the random
sampling. In the limit of very long histories, the Poisson process
has a standard deviation of recurrence intervals equal to its
mean. Thus a recurrence history with standard deviation close
to the mean favors a Poisson process, whereas a standard deviation significantly smaller than the mean suggests a Gaussian
or other time-dependent process. How to interpret the limited
earthquake histories available is an interesting question, as
illustrated by this simple example with ten recurrences, which
is longer than usually available.
These examples bear out that estimates of earthquake probabilities depend significantly on both the probability distribution used and the parameters for that distribution, which are
generally not well constrained by observations. For example,
the analysis in Fig. 4.7-9 used a Gaussian distribution with a
mean and standard deviation of 194 and 58 years, corresponding to the most recent five major earthquakes at Pallett Creek.
Alternatively, the past ten earthquakes there yield a recurrence with a mean and standard deviation of 132 and 105 years
(Section 1.2.5). Other probability distributions give different
probability estimates, as illustrated by the curves in Fig. 4.7-9
corresponding to Poisson and Weibull distributions. Similarly,
different estimates would result from using a log-normal distribution in which the natural logarithm of recurrence time is
normally distributed, so recurrence intervals longer than the
mean are more likely than shorter ones.
Hence earthquake forecasts are easy to make, but hard to
test. Because the estimates must be tested using data that
were not used to derive them, hundreds or thousands of years
Fig. 4.7-10 Synthetic earthquake histories computed by sampling a
Poisson model with the recurrence time of 194 years and a Gaussian
model with this recurrence time and standard deviation 58 years. The
Gaussian model yields a more periodic series, whereas the Poisson model
yields clustering.
500
Poisson model
0
1000
1500
2000
500
Gaussian model
0
1000
1500
2000
Years
Fig. 4.7-11 Portion of the seismic gap map (McCann et al., 1979) used
by Kagan and Jackson (1991) to test the gap hypothesis. The shaded
segments of the plate boundaries had been assigned seismic potentials of
high (red, R), intermediate (orange, O), and low (green, G). Unshaded
segments were regarded as having uncertain potential. During the ten
years following the map’s publication, ten large (M > 7) earthquakes
(dots) occurred in these regions. None were in the high- or intermediaterisk segments, and five were in the low-risk segments. (Stein, 1992.
Reproduced with permission from Nature.)
60°
135°E
O
150°E
154°E
180°
165°W
150°W
135°W
120°W
Pacific
Ocean
45°
30°
15°
G
R
O
O
R
G
O
O
G
Asia
G
G
North
America
G
G
R
O
N
times of −1.17 and −0.83, with probabilities of 0.12 and 0.20.
Thus the conditional probability (Eqn 12) is
C(2003, 1983) = (P(2003) − P(1983))/(1 − P(1983))
= (0.20 − 0.12)/(1.0 − 0.12) = 0.09,
(14)
or 9%. The probability for successive 20-year intervals
increases with time, and so is 29% if the earthquake has not
occurred by 2057, and 56% if it has not occurred by 2157.
It is interesting to compare these time-dependent probabilities to those predicted by the time-independent Poisson
model. For an assumed mean recurrence time of 194 years, the
probability in 20 years is 10%. Thus for times since the previous earthquake less than about 2/3 of the assumed recurrence
interval, the Poisson model predicts higher probabilities. At
about 2/3 of the interval, in this case about 1986, the models
predict comparable probabilities. At later times the Gaussian
model predicts progressively greater probabilities. This comparison illustrates the seismic gap concept: a gap exists when
it has been long enough since the last major earthquake that
time-dependent models predict an earthquake probability much
higher than expected from time-independent models.
The differences between the models can be illustrated by
comparing the earthquake histories that each predicts. Figure
4.7-10 shows synthetic earthquake histories generated by randomly sampling probability distributions with the parameters
used in Fig. 4.7-9. In the simulation, both models yield ten
earthquakes after an earthquake at time zero. The earthquakes
from the Poisson model have a mean recurrence of 189 years
and a standard deviation of 107 years, whereas those for the
Gaussian model have a mean and standard deviation of 191
and 58 years, respectively. The difference results from the fact
that the Poisson process is time-independent, so there are both
shorter and longer intervals between earthquakes than for the
Gaussian process, which is more regular. The Poisson process