

Level of reliability
(with A being most reliable)
1.0
0.5
0
Conditional probability
Conditional probability of major
earthquakes along segments of the
San Andreas fault 1988 –2018
San
Bernardino
Los
Angeles
San
Bernard ino
Mtns
San
Francisco
C o a c h e ll a
V a ll e y
Mojave
C ar riz o
Chotame
Parkfield
S. Santa Cruz Mtns
S. F. Peninsula
N o r t h C o a s t
A
B
C
D
E
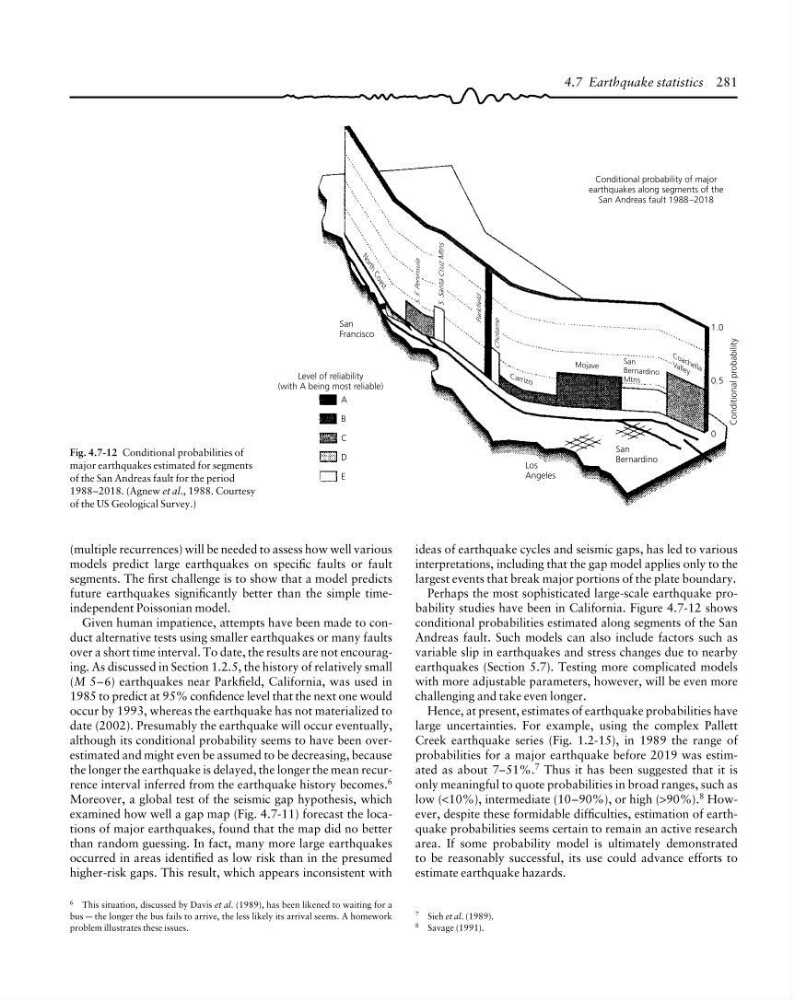
Fig. 4.7-12 Conditional probabilities of
major earthquakes estimated for segments
of the San Andreas fault for the period
1988–2018. (Agnew et al., 1988. Courtesy
of the US Geological Survey.)
4.7 Earthquake statistics 281
6 This situation, discussed by Davis et al. (1989), has been likened to waiting for a
bus — the longer the bus fails to arrive, the less likely its arrival seems. A homework
problem illustrates these issues.
7 Sieh et al. (1989).
8 Savage (1991).
(multiple recurrences) will be needed to assess how well various
models predict large earthquakes on specific faults or fault
segments. The first challenge is to show that a model predicts
future earthquakes significantly better than the simple timeindependent Poissonian model.
Given human impatience, attempts have been made to conduct alternative tests using smaller earthquakes or many faults
over a short time interval. To date, the results are not encouraging. As discussed in Section 1.2.5, the history of relatively small
(M 5–6) earthquakes near Parkfield, California, was used in
1985 to predict at 95% confidence level that the next one would
occur by 1993, whereas the earthquake has not materialized to
date (2002). Presumably the earthquake will occur eventually,
although its conditional probability seems to have been overestimated and might even be assumed to be decreasing, because
the longer the earthquake is delayed, the longer the mean recurrence interval inferred from the earthquake history becomes. 6
Moreover, a global test of the seismic gap hypothesis, which
examined how well a gap map (Fig. 4.7-11) forecast the locations of major earthquakes, found that the map did no better
than random guessing. In fact, many more large earthquakes
occurred in areas identified as low risk than in the presumed
higher-risk gaps. This result, which appears inconsistent with
ideas of earthquake cycles and seismic gaps, has led to various
interpretations, including that the gap model applies only to the
largest events that break major portions of the plate boundary.
Perhaps the most sophisticated large-scale earthquake probability studies have been in California. Figure 4.7-12 shows
conditional probabilities estimated along segments of the San
Andreas fault. Such models can also include factors such as
variable slip in earthquakes and stress changes due to nearby
earthquakes (Section 5.7). Testing more complicated models
with more adjustable parameters, however, will be even more
challenging and take even longer.
Hence, at present, estimates of earthquake probabilities have
large uncertainties. For example, using the complex Pallett
Creek earthquake series (Fig. 1.2-15), in 1989 the range of
probabilities for a major earthquake before 2019 was estimated as about 7–51%. 7 Thus it has been suggested that it is
only meaningful to quote probabilities in broad ranges, such as
low (<10%), intermediate (10–90%), or high (>90%). 8 However, despite these formidable difficulties, estimation of earthquake probabilities seems certain to remain an active research
area. If some probability model is ultimately demonstrated
to be reasonably successful, its use could advance efforts to
estimate earthquake hazards.
(with A being most reliable)
1.0
0.5
0
Conditional probability
Conditional probability of major
earthquakes along segments of the
San Andreas fault 1988 –2018
San
Bernardino
Los
Angeles
San
Bernard ino
Mtns
San
Francisco
C o a c h e ll a
V a ll e y
Mojave
C ar riz o
Chotame
Parkfield
S. Santa Cruz Mtns
S. F. Peninsula
N o r t h C o a s t
A
B
C
D
E
Fig. 4.7-12 Conditional probabilities of
major earthquakes estimated for segments
of the San Andreas fault for the period
1988–2018. (Agnew et al., 1988. Courtesy
of the US Geological Survey.)
4.7 Earthquake statistics 281
6 This situation, discussed by Davis et al. (1989), has been likened to waiting for a
bus — the longer the bus fails to arrive, the less likely its arrival seems. A homework
problem illustrates these issues.
7 Sieh et al. (1989).
8 Savage (1991).
(multiple recurrences) will be needed to assess how well various
models predict large earthquakes on specific faults or fault
segments. The first challenge is to show that a model predicts
future earthquakes significantly better than the simple timeindependent Poissonian model.
Given human impatience, attempts have been made to conduct alternative tests using smaller earthquakes or many faults
over a short time interval. To date, the results are not encouraging. As discussed in Section 1.2.5, the history of relatively small
(M 5–6) earthquakes near Parkfield, California, was used in
1985 to predict at 95% confidence level that the next one would
occur by 1993, whereas the earthquake has not materialized to
date (2002). Presumably the earthquake will occur eventually,
although its conditional probability seems to have been overestimated and might even be assumed to be decreasing, because
the longer the earthquake is delayed, the longer the mean recurrence interval inferred from the earthquake history becomes. 6
Moreover, a global test of the seismic gap hypothesis, which
examined how well a gap map (Fig. 4.7-11) forecast the locations of major earthquakes, found that the map did no better
than random guessing. In fact, many more large earthquakes
occurred in areas identified as low risk than in the presumed
higher-risk gaps. This result, which appears inconsistent with
ideas of earthquake cycles and seismic gaps, has led to various
interpretations, including that the gap model applies only to the
largest events that break major portions of the plate boundary.
Perhaps the most sophisticated large-scale earthquake probability studies have been in California. Figure 4.7-12 shows
conditional probabilities estimated along segments of the San
Andreas fault. Such models can also include factors such as
variable slip in earthquakes and stress changes due to nearby
earthquakes (Section 5.7). Testing more complicated models
with more adjustable parameters, however, will be even more
challenging and take even longer.
Hence, at present, estimates of earthquake probabilities have
large uncertainties. For example, using the complex Pallett
Creek earthquake series (Fig. 1.2-15), in 1989 the range of
probabilities for a major earthquake before 2019 was estimated as about 7–51%. 7 Thus it has been suggested that it is
only meaningful to quote probabilities in broad ranges, such as
low (<10%), intermediate (10–90%), or high (>90%). 8 However, despite these formidable difficulties, estimation of earthquake probabilities seems certain to remain an active research
area. If some probability model is ultimately demonstrated
to be reasonably successful, its use could advance efforts to
estimate earthquake hazards.